- Houston Building Permit Value 14 Percent Lower Than This Time Last Year, Finds Greater Houston Partnership [KUHF]
- Council Vote Today on $7.35M Loan To Turn Downtown Building at Main, Rusk into Luxury Hotel [Prime Property; previously on Swamplot]
- Nordstrom May Take Sears Space at Woodlands Mall [Shop Girl]
- Redesigned Pasadena H-E-B To Open August 8; Now One of Largest of Chain’s Stores in Houston Area [Pasadena Citizen]
- Noise Ordinance Opponents Want To Create Program of Voluntary ‘Certificates for Sound’ [Rocks Off]
- Harris County Commissioners Pass Resolution Supporting Extension of Metro General Mobility Payments [Houston Chronicle]
- Megabus Moves Downtown Stop to Pierce and Travis [Houston Chronicle]
- Charting Metro Ridership from 1997 to 2012 [HAIF]
- Houston Named One Of America’s Emptiest Cities Based on Homeowner Vacancy Rates [Yahoo! Homes via Houston Agent Magazine]
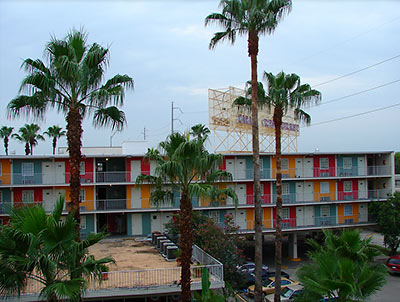
Photo of Midtown Terrace, 4640 Main St.: Russell Hancock via Swamplot Flickr Pool


Yep, METRO continues its decline and for some reason they want billions of dollars to continue this decline?
Some of these stories seem to tell a different story than the one our mayor is telling, or peddling, around. As for Metro well did anyone really think George Greanias was really going to turn anything around? He probably still spends most of his time on the internet looking for “callboys.” He should have been fired over that. But, well, it wouldn’t have been politically correct I guess.
Did you actually read the HAIF article? They changed the reporting practices which they use to measure ridership which caused the large drop in numbers.
Metro has roughly the same ridership as it did 15 years ago. Not exactly a decline. Perhaps it would have more riders if a quarter of the money allotted to it wasn’t being pilfered for roads?
Harris County continues its addiction to concrete.
Perhaps METRO is declining due to lack of funding?
That CNBC article isn’t based on homeowner vacancies, it is about rental vacancies.
8. Houston
12-Month Averages:
Rental vacancy rate: 15.5%
Homeowner vacancy rate: 1.9%
Houston is home to the nation’s third-highest rental vacancy rate over the past 12 months, standing at 15.5 percent. The city hit a three-year high for rental vacancies in 2009, when the rate rose to 18.4 percent in the third quarter of that year, according to Census Bureau data. However, Houston’s homeowner vacancy rate has been recovering, dropping below the average for the 75 largest cities for the past three quarters to as low as 1.1 percent at the end of 2011.
Perhaps ridership isn’t increasing because the routes aren’t expanding? If there were only one line of trains in London, NYC, Chicago, Boston, Paris, etc. what would their ridership be?
Mike: Might I add that Metro might have more ridership if they planned their routes with a bit more intelligence and offered services to the suburbs. I know that in Pasadena and the surrounding area, Harris County has some bus routes, but the hours and routes aren’t exactly practical if you need to catch a local Metro bus downtown. And it does not run on weekends. Oh, and Metro needs to tell some of their drivers to show up on time and not take off if they are few minutes early to a stop. (Yes, I had to take Metro for a couple of months while saving up for a car repair. One of my return buses home was consistently late, which forced me to miss my second bus, which meant another half-hour wait for the next. Then they closed the Pasadena Park and Ride. So much for encouraging those of us out in the ‘burbs to take public transportation instead of driving.)
The graphs in the HAIF posting are the basic stats.
If you get the Actual METRO data, you’ll see the full story. The data in HAIF is boardings (which is not the same as ridership). If you want ridership, at minimal, divide the numbers in half if not by 4.
Since most riders don’t use Q cards, METRO can’t track their trips. METRO also re-aligned many bus routes after the METRO rail was operational that cause many single trips to multiply with transfers. Boardings is a way to cover the true ridership numbers and inflate the appearance of growth. METRO really doesn’t want to you see any of that data or you’ll see the actual decline.
So as for the HAIF post, we learned very little about METRO’s ridership.
What does the Midtown Terrence have to do with Houston permit value? It’s full!
There was no big increase in total boardings after light rail was added, so this whole theory of a boarding-increase scheme by making people transfer to LRT doesn’t really hold water.
Also, if the graph is in error because it shows only boardings, shouldn’t this error be roughly constant throughout? In other words, this shouldn’t detract from the graph’s ability to show increase or decline.
It is all a lie!! Get on the light rail and count the people, there aren’t many riding it. Same as Astros, go to the game and count the actual attendees. paid attendance will be 13,000 but actual attendance is more like 3000
Metro has roughly the same ridership as it did 15 years ago. Not exactly a decline.
—————————–
Houston has a lot more people now than it did 15 years ago. If the same number of people are riding METRO now as then, that’s certainly a decline on a percentage basis.
Benny,
Uh, what? Sarcasm?
If anything, there is more ridership on the light rail than reported, lol.