 Swamplot is sponsored today by Judy Thompson, Exclusively a Buyer’s Agent. Thanks for your continuing support of this website, Judy!
And just in time for her latest stats on Houston residential real estate! Judy Thompson compiles and updates them regularly on the West U Real Estate website, which she’s operated since 2003.
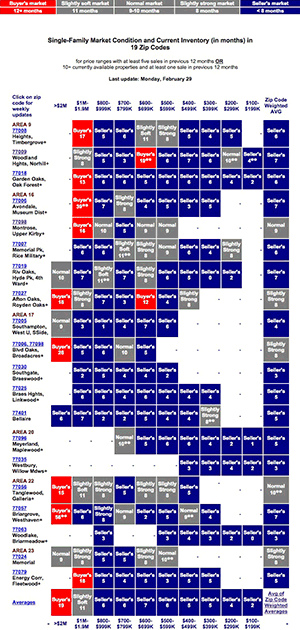
The site’s regular updates of Houston residential market conditions for homes in 10 separate price ranges in 19 popular Houston Zip Codes take into account the amount of inventory currently available and the pace of sales in the previous 12 months. The charts show whether by each calculation the current market favors buyers, sellers, or neither (a “normal†market). Here’s the the latest overall chart.
A separate chart on the site plots the average of the weighted averages from the market conditions chart, attempting to illustrate the change in housing inventory in 6 MLS areas over time. That chart shows a bit of an uptick from the last month, but the average inventory is still close to a 6-month supply, according to her latest data.
More detailed figures for each Zip Code are provided on separate charts. If you’re tracking real estate values in any of the areas she covers, you’ll find her site to be a helpful resource. Thompson has worked as a buyers’ agent exclusively since 1997.
Got some numbers you’re working to keep up? A Swamplot sponsorship could help with that.


