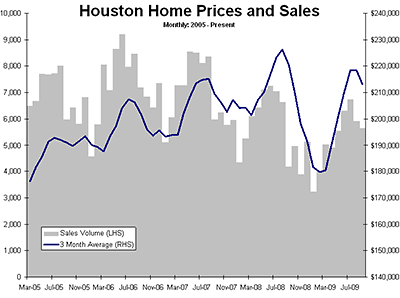
HAR is out with its September home-sales figures, giving Swamplot’s spreadsheet-side correspondent a chance to eulogize the spring-summer selling season:
Home prices and volumes are flying south for the winter. With this volume downturn for the year, we have most likely seen the highs and sales volumes will now complete their third year of contraction. Prices were down 2-3% in the month, depending on whether you follow the median price or the average price. Pending sales are well below sales for the month, suggesting a further seasonal contraction in October.
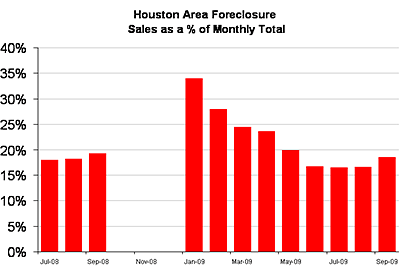
This month featured an upturn in foreclosure sales as a percentage of the total. Foreclosure sales were 18.6% up from 16.7% the prior month. Luckily, foreclosure sales are still way down from the 32% peak in January.
But aren’t all those foreclosures going away soon?
***
Don’t count on it:
Next month and the months following will most likely see a higher foreclosure mix. A wintery mix! This is because the sales from the foreclosure gavel are hitting the market at a constant rate and take place at freezing cold temperatures, lately averaging about $90,000.
Regular sales at higher non-distressed prices follow our often discussed seasonal trend. As these cool heading into winter, median and average prices move toward the foreclosure average due to the change in sales mix. . . .
This change in mix will likely mean a higher amplitude in the monthly pricing statistics so the winter lows may get especially frosty this year.
I did get a chuckle from the association’s spin: “Foreclosure property sales continued to slow in September, making up 18.6 percent of all single-family home sales in the Houston area compared to 19.3 percent in September 2008 and the 12-month peak of 34.0 percent in January of this year.†Indeed, sales are well below the peak and the market has absorbed many foreclosures without creating a backlog and deadly negative feedback loop.
The red graph below, however shows a rising mix, not a falling one:


Fun with numbers!
Let’s all get out statistician caps on! I will still always remember the book on one of my college professor’s shelves called “How to Lie with Statistics!”
These are all in the boonies. The market is good. So says HAR and the “silk stocking” realtors. Better hurry and grab that $5 million home in Tanglewood while you can!
Wonder when the half-price sale will hit?
Wow. I have feeling this “correspondent” is the type of person who snoops around after dark taking photos in attempt to lampoon the pillars of the houston real estate community. the stats are the stats and the old real estate saying holds true, “you can’t make a silk purse out of sow’s ear.”
In the anatomy of a disaster there is the ‘denial phase’. The B.S. being spread by the HAR is proof that they are in the denial phase. The problem is that many sellers believe it. Here’s a historical analogy:
New Orleans 2005: “My house is 12 feet below sea level. The levies around my house were only engineered to withstand a cat’ 3 hurricane. There is a cat’ 5 hurricane in the gulf but it won’t hit me.”
Houston 2009: “I bought my house in 2005 for 150k. I’m presently trying to sell it for 250k but can’t find a buyer. I’ll just rent it out for $1000/month until the market turns around.”
Super statistical with the realistical, satirical in the umbilical… Houston’s foreclosure numbers are only higher than phoenix because of population.. Maricopa county az has some of the worst downturns in the history of free markets.