Today Swamplot is again sponsored by Judy Thompson, exclusively a buyer’s agent. Thanks for your support, Judy!
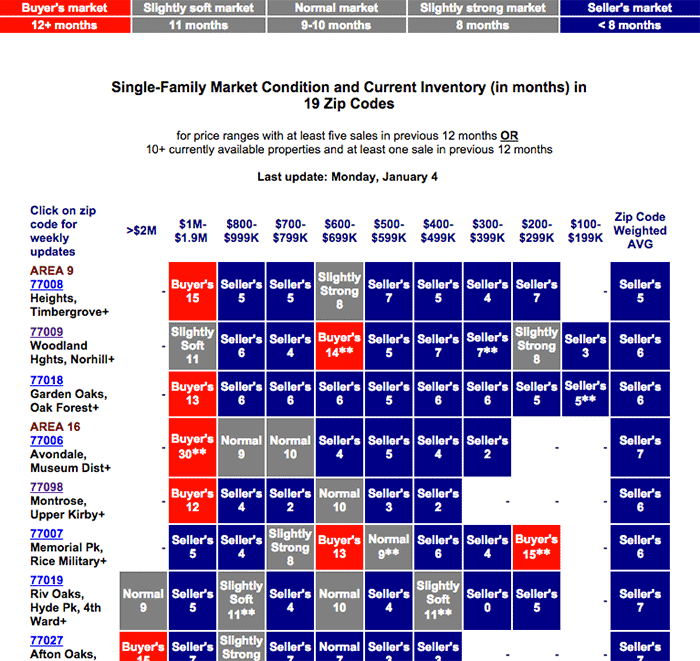
Judy Thompson has operated the West U Real Estate website since 2003. The site provides regular assessments of Houston residential market conditions for homes in 10 separate price ranges in 19 popular Houston Zip Codes. Thompson’s regularly updated calculations take into account the amount of inventory currently available and the pace of sales in the previous 12 months. Color-coded charts show whether by each calculation the current market favors buyers, sellers, or neither (a “normal†market). A portion of the latest overall chart, which came out yesterday, is reproduced above.
A separate chart on the site plots the average of the weighted averages from the market conditions chart, attempting to illustrate the change in housing inventory in 6 MLS areas over time. (The lowest point was the 2-month supply that held roughly from spring 2013 to spring 2014 — “that crazy free-for-all when anything decent had multiple offers by day 3,†Thompson notes.) The average inventory currently is just under a 6-month supply, according to her latest data.
More detailed figures for each Zip Code are provided on separate charts. Thompson has worked as a buyers’ agent exclusively since 1997.
Hoping to find a way for your business to climb the charts? Consider becoming a Swamplot site sponsor.


