

Just in from real-estate data firm First American CoreLogic: This handy map of the greater Houston area, showing foreclosure rates by Zip Code. And yes, compared to this time last year, the numbers are still up:
. . . the rate of foreclosures among outstanding mortgage loans is 1.20 percent for the month of July, an increase of 0.30 percentage points compared to July of 2008 when the rate was 0.80 percent. . . . Foreclosure activity in Houston-Sugar Land-Baytown is lower than the national foreclosure rate which was 2.80 for July 2009, representing a 1.60 percentage point difference.
Also in Houston-Sugar Land-Baytown, the mortgage delinquency rate has increased. According to First American CoreLogic preview data for July 2009, 4.80 percent of mortgage loans were 90 days or more delinquent compared to 3.30 percent for the same period last year, representing an increase of 1.60 percentage points.
- Foreclosure Rates in Houston-Sugar Land-Baytown Increase [First American CoreLogic]
- July 2009 Foreclosure Rate by ZIP Code Houston-Baytown-Sugar Land, TX [First American CoreLogic]
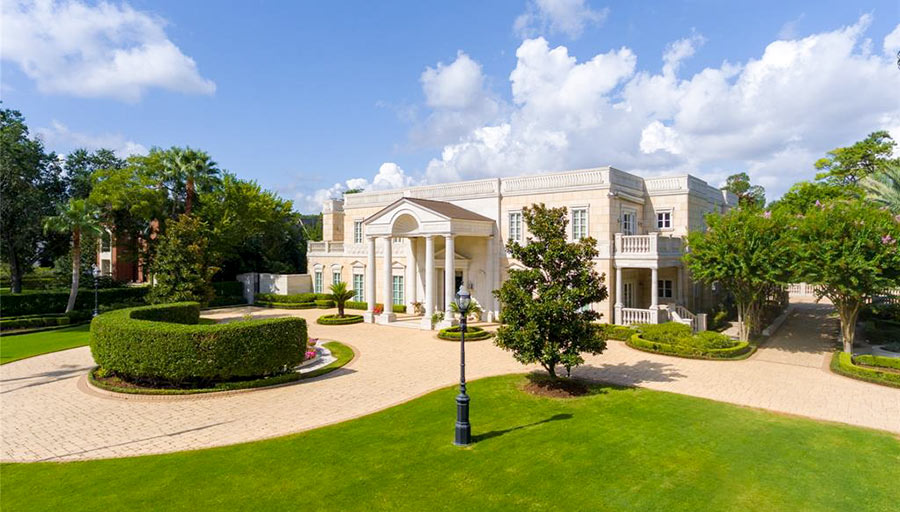
The problem I have with this is that it indicates the problem with foreclosures is in certain areas of the city and so it becomes a little “prejudicial” in that respect. You may have 30 $100,000 homes in Southwest Houston and one $3,000,000 home in Piney Point. If the lienholder is the same, they have lost an equal amount of money if all go into foreclosure and are sold for less than loan value. And there have been quite a few of those $3,000,00 homes that have gone into default. The difference is, the big difference, the owner of the $3,000,000 home is allowed extra time, sometimes allowed to refinance or make interest only payments or just put it on the market with no real threat of actual foreclosure. That’s in Piney Point. In Southwest Houston it is posted as soon as it can be on the list of foreclosures to be sold on the courthouse steps.
If the lienholder is the same, they have lost an equal amount of money if all go into foreclosure and are sold for less than loan value.
____________________
Not true at all. The transactional costs of each foreclosure would make the 30 foreclosures a much more expensive proposition for the bank.
Freddie Mac has stated that the average foreclosure costs them around $60,000.
And please post the addresses of all these $3,000,000 homes going into foreclosure.
Another quality conspiracy theory by Matt.
And please post the addresses of all these $3,000,000 homes going into foreclosure.
________________
Learn to read. The rich make deals. The poor get tossed out on the streets.
I notice your entirely ignored my first point.
Please post some evidence or examples of this “deal making” then. Anything to support your wild speculation.
Zip code 77005
address 3760 Ingold
value $1,178,000 (HCAD tax $1,600,000)
Owner Scott Wizig; AKA=”slumlord scott”
google his name
Could not have happened to a better guy!
Bozo, that’s so mean.
I like to think of it as “karma”…..
I like to think of it as “karmaâ€â€¦..
_________________________
It is. And I was just being “tongue-in-cheek.”
Hopefully he will end up with “himself” as a landlord. Tit for tat and all that.
Learn to read. The rich make deals. The poor get tossed out on the streets.
No one ever said being poor was fun or easy.
Aside from all the bickering above…. I find it interesting that Boliver is dark red. So did the mortgage companies forclose on all the properties washed away by the Hurricane? That’s gotta suck,
A large part of Bolivar is going to be turned into a nature preserve. FEMA is buying out many of the properties. See:
http://offcite.org/2009/08/28/making-sense-of-ike
I suppose that buyout was made easier by the rate of foreclosures.
What is the story with the bright red near Waller and Brazoria?