HAR’s real estate sales report for July is out! And Swamplot’s housing-market reader-analyst uses the data to piece together a better picture of Houston’s still-somewhat-mysterious foreclosure scene:
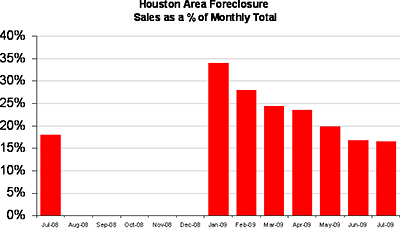
The press releases in 2009 have included a running commentary on the % of foreclosure sales in the month. This month’s release featured an interesting nugget — foreclosure sales from the prior year’s month! It is new information, and a few future monthly releases of it will allow us to fill in the data gap in the graph [above].
The foreclosure graph can be looked at in two ways. The glass half full crowd can cite the fact that a wave of foreclosures has been passed through the system — like a painful kidney stone — and it hasn’t led to piles and piles of unsold homes on top of each other in a negative feedback loop. Inventory is down to 6.5 months, backing this view.
And what if you aren’t sure there’s enough water in that glass to, uh . . . pass those stones?
***
Those who see a half empty glass can see plainly that 15% foreclosures is far from a “stable†situation and will act as a weight on prices for some time.
Doing some basic data mining into the sales and foreclosure %s here in Houston reveals that an average of 1,120 foreclosed homes are sold a month through the MLS system (does not include auctions). Considering that housing starts are sharply down from 28,000 in 2008 (Metrostudy) to 20,000 in 2009 (Metrostudy), the 1,200 a month in foreclosures are stepping in to fill the 700 a month slowdown in starts.
So what’s coming?
Foreclosures are set to rise nationally in the coming months as moratoriums expire. As we see data point after data point confirming that Houston is in no way special or different, we will see rising foreclosures here in coming months as well. At least we don’t have a giant inventory of unsold homes like other cities.
Or do we?
Foreclosure resales are the end of the process and we have to watch the beginning. I would love to know what the monthly Notices of Default numbers are to see if banks are sitting on homes and are too scared to foreclose. [This] chart outlines the “shadow inventory†problem in San Francisco. We may have this problem here in Houston or we may not.
Well, good thing that’s all settled. So how about the market overall?

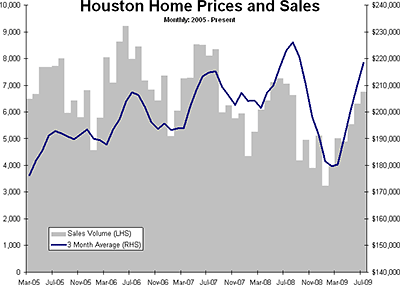
The distressed/normal “product mix†stopped improving, so we had a slowing in the strong seasonal price increases. July/August have been the seasonal peak in prices and sales every year so we may yet squeeze one more good report out in 2009.
- MLS Report for July 2009 [HAR]
- Houston home sales decline again, but rate slowing [Houston Chronicle]
- ‘Shadow Inventory’ Called a Threat to the Industry
[SFGate]


HAR’s “statistics” are highly dubious and should not be taken by anyone to mean anything. That said, I’m more concerned about the upcoming commercial real estate crash. That will take out more banks like Guaranty.
Does anyone really believe anything HAR says any more?
To quote CalculatedRisk blog: “I think some pundits have it backwards: Instead of a strong local economy keeping housing afloat, I think the bursting housing bubble will significantly impact housing dependent local economies.”