Some highlights from the Chronicle‘s annual housing-price survey extravaganza, published Sunday:
- Yeah, prices were up again last year, growing steadily since 1992 (a good year to start with if you’d rather forget Houston’s big busts). But price increases slowed down in the second half.
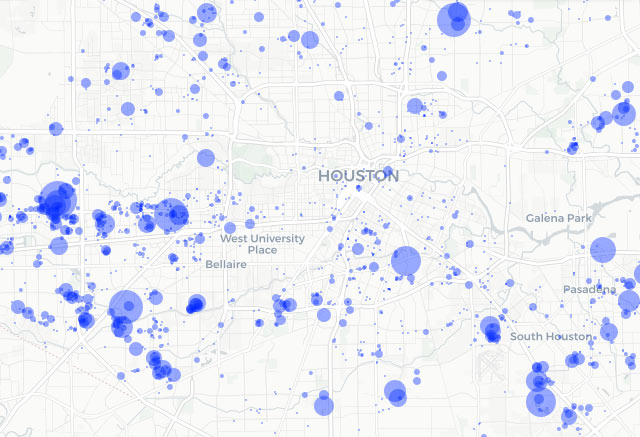
- Anyone needing proof that Houston is still a donut need only glance at this map of sales activity inside and around the Loop and Beltway. We love that creamy filling as much as anyone, but there’s more dough to be made at the edges (eighty percent of sales are outside Beltway 8).
- The front-page graphic, which at first glance appears to show steeper historical price growth for inside-the-loop homes (and a better rate for them this year), is a little misleading: Except for last year, average percentage price increases since 2001 have been highest outside the loop.
As usual, specifics on last year’s neighborhood price trends are hidden in the Chronicle‘s Homefront section.
- Houston area home prices continue to climb [Houston Chronicle]
- Homefront [Houston Chronicle]


