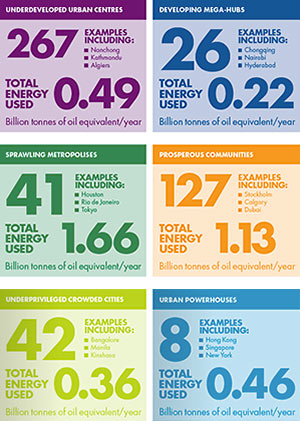
 The folks at Shell may not have known a new campaign was about to kick off declaring Houston to be “The City of No Limits,” but a new report from the oil company on the future of cities around the world certainly helps reinforce a just-as-proud image of our 8,778-square-mile Texas spread. “New Lenses on Future Cities,” one of a series of just-released “scenario” studies sponsored by Shell in conjunction with The Centre for Liveable Cities in Singapore, classifies urban areas around the world into 6 distinct categories based on common features.
Houston, according to the researchers, is too large to be considered one of the Prosperous Communities, and hasn’t earned its way into the Developing Mega-Hubs or Urban Powerhouses clubs. (It certainly doesn’t qualify as an Underprivileged Crowded City or Underdeveloped Urban Centre either) Instead, the report says Houston is a seminal example of a Sprawling Metropolis, proudly featuring it on some accompanying infographics illustrating the archetype (see the green square above). (Other members of this distinctive group of 41 cities include Rio de Janeiro, Tokyo, and Los Angeles.)
***
Though the report identifies a number of common characteristics of Sprawling Metropolises (low average densities in extensive suburbs, where most residents live; “high-value, service-based economies with industry largely pushed outside the city limits and mobility built primarily around the carâ€), the most distinctive feature of the Sprawling Metropolis is high energy use, which, the report says, is “driven by high per capita incomes, larger homes and sprawling suburban areas, and is concentrated in housing and transport.â€
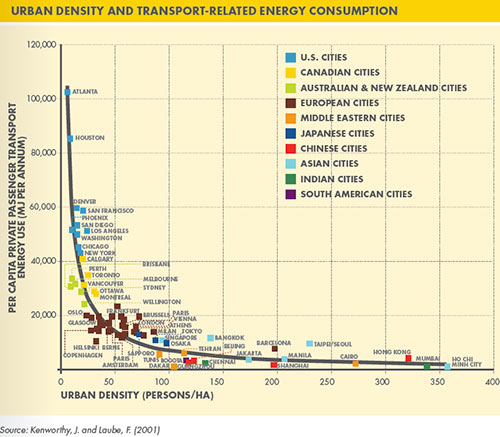
That energy consumption is the standout feature of Sprawling Metropolises — and Houston in particular — is punctuated by a graph included in the oil company report that compares urban density to energy use for private transportation per resident (see below). Unfortunately, the graphic comes from a 2001 study, and likely relies on even older data. But more than a dozen years later, Houston’s appearance as the almost-King of the Hill in the graph’s upper left quadrant remains impressive. In the low-density, using-lots-o’-gas segment, Houston is bested only by Atlanta:

Here’s a video summarizing the classifications developed in the report:
- Shell Scenarios and New Lenses on Future Cities; Report (PDF) [Shell]
- Previously on Swamplot: Animated Growth Maps Help Show Off Houston as ‘The City with No Limits’; New ‘City with No Limits’ Slogan Will Be a Catchy, Fun Way To Promote Houston’s Legendary Sprawl
Images and video: Shell


Using 2001 data to make a point about current energy usage is pretty lame. In 13 years there have been a lot of changes in energy efficiency. Given the asymptotic shape of the curve, even small changes could put Houston at a very different place on it.
Interesting that some Australian cities with similar density levels to Houston still manage to consume less transport energy per person.
It’s also interesting to think about how, on the one hand, higher energy consumption for transport means we’re more vulnerable to price increases. However, the massive increase in the price of oil is exactly what led to the latest oil boom that brought so much growth to Houston since the early 2000s. This could be a problem, though, if any sort of carbon tax that increases the cost of fossil energy is enacted because that extra cost won’t be passed on to local businesses.
great, so the “city with no limits” slogan applies to greater car emissions and cancer diagnosis rates as well? brilliant, stay classy htown.
You know things are going badly when you get a “stay classy” comment in the mix.
The 64 billion dollar question for Houston is whether the benefits from a spike in gas prices (i.e. increased activity in the energy sector, more jobs, better wages, etc.) would be enough to offset the significant increase in cost of living that would be associated with higher gas prices. I would suspect that it would not as the cost of housing has already put the squeeze on many household budgets already.
I buy L.A. as a comp, but Tokyo? I don’t buy it.
Makes sense, as population density increases per square mile you would get an x^(-2) graph. Interestingly as a function of commute times Houston is pretty good. Houston average is 28 minutes. New York is 39. Beijing is 84. A bit of internet searching will show you “commute indexes” and other goofiness… I’m all for improving commute times but let us look at what the data shows us. Houstonians are willing to trade energy (and therefore money and time) for a shorter commute compared to other cities and a lower population density. Given Houston ranks low on average gasoline prices (currently $3.41/gal) the financial tradeoff isn’t as great as it is in other cities like Los Angeles ($4.13/gal) (average commute 29 minutes.) That gallon of gasoline costs us about 20% less.
Yeah, I also feel like the 2001 data on megajoules per capita is of dubious relevance. Back then, people still used bicycles as the primary mode of urban transport in Asia; nowadays, every major city is massively congested with cars and motorbikes and about the only folks on bicycles are schoolchildren and a handful of middle-class cycling enthusiasts.
Color me optimistic, but I would suspect that 13 years into the future, we’ll all be better off by some means or another. Maybe taxi companies will finally ‘get it’ and give us driverless on-demand carpooling. If not, then maybe transit agencies will have to take vanpooling programs in that direction. Somebody’s gonna do it, though, and when they do it’ll change the way that we frame our debates about infrastructure, energy, and ecology.