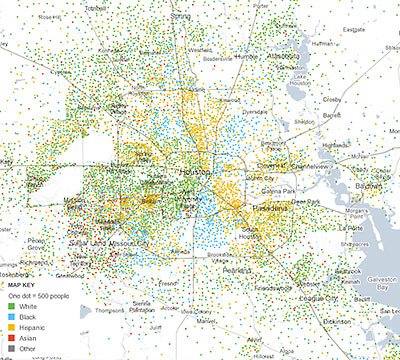
Remember those cool dot-by-dot renderings detailing the racial and ethnic distributions of 100 or so cities Swamplot featured a few months ago? Eric Fischer’s eye-opening map of Houston showed a city striped with different-colored pie-shaped wedges, but didn’t have much you could dig into. Working with data company Social Explorer, the New York Times website now has a version that displays much the same information, but it’s interactive, and allows you to zoom in on individual Census tracts. The “Mapping America” project covers the entire country and allows exploration of other metrics related to ethnicity, housing and families, income and education. Nothing’s included from the 2010 Census yet, though: the data comes the Census Bureau’s annual American Community Survey through 2009.
A few notable Houston-area snapshots include this map to same-sex couples:
***
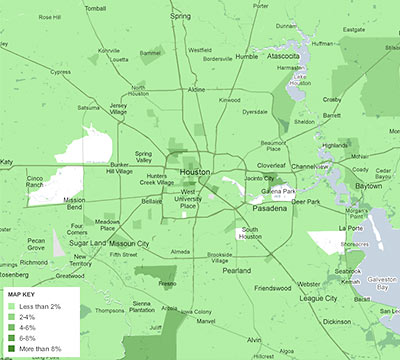
Another graphic showing median household income by Census tract:
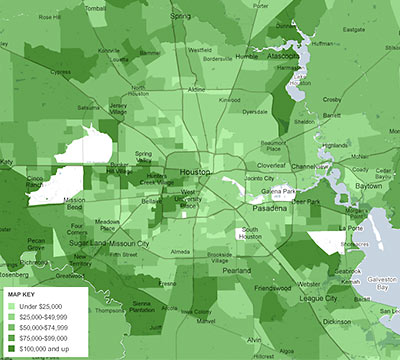
Changes in median household income since 2000:
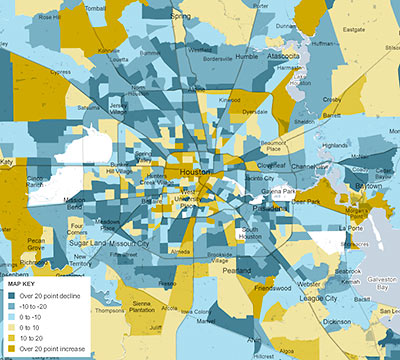
And changes in median monthly rent since 2000:
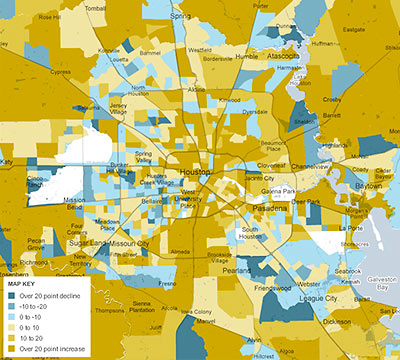
More, including changes in median monthly home values, here.
- Mapping America: Every City, Every Block [New York Times]
- Previously on Swamplot: Slicing the Pie: A Map of Houston by Race
Images: New York Times and Social Explorer


I’m surprised to see the same percentage of same sex couples down in the boonies as in Montrose.
it appears the montrose area in general was not well recorded in the data being represented. the rents, median incomes, etc. should all be more in line with the immediately surrounding areas.
i sure as hell haven’t found these blue areas where rent has decreased since 2000.
guess i looked at the wrong chart when referring to rent, but still, i would have expected some bigger jumps in the area.
@Brian – I’m not that surprised. I know an awful lot of same sex couples who live in Sugar Land, Kingwood, Spring, etc., often for the same reasons that mixed couples do: big house, they spend more time at home since marrying, they have kids, they want a big garden, etc.
Remember, the same-sex chart does not account for population DENSITY. Therefore, a thousand folks in say, the Cypress area, might “light-up” the chart with the same color as 5,000 people inside the Loop.
I’m pretty sure this chart, w/a pop. density overlay, would show that the vast majority of same-sex couples still live inside/around Loop 610, with just a couple of exceptions.
Charts can be misleading.
Run for the Hills we Gays are taking over! Dont Ask and We Wont tell on you.
@Jon: Did someone make some gay comment that caused you to make that reply?