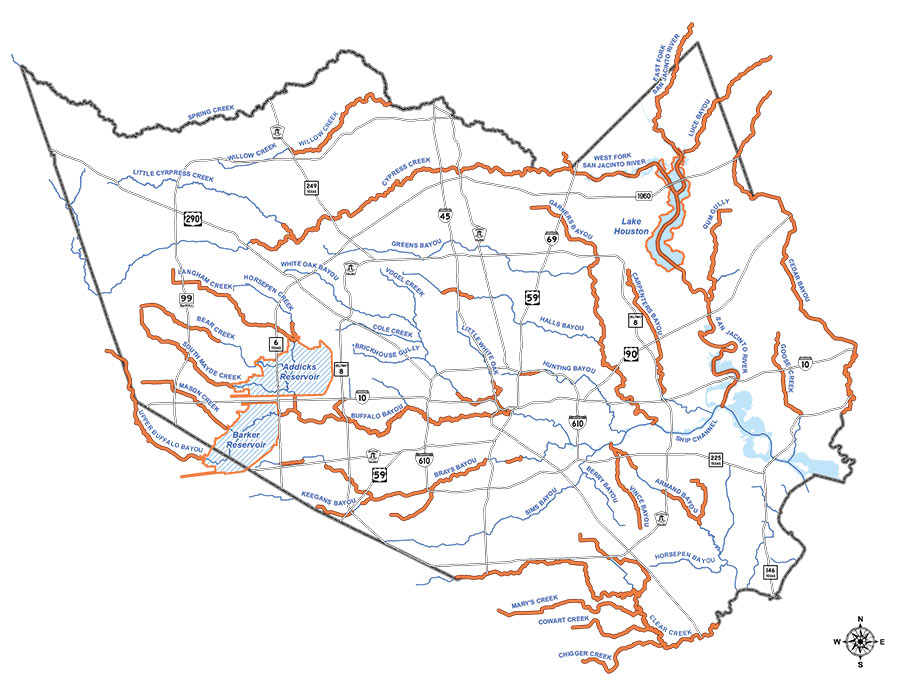
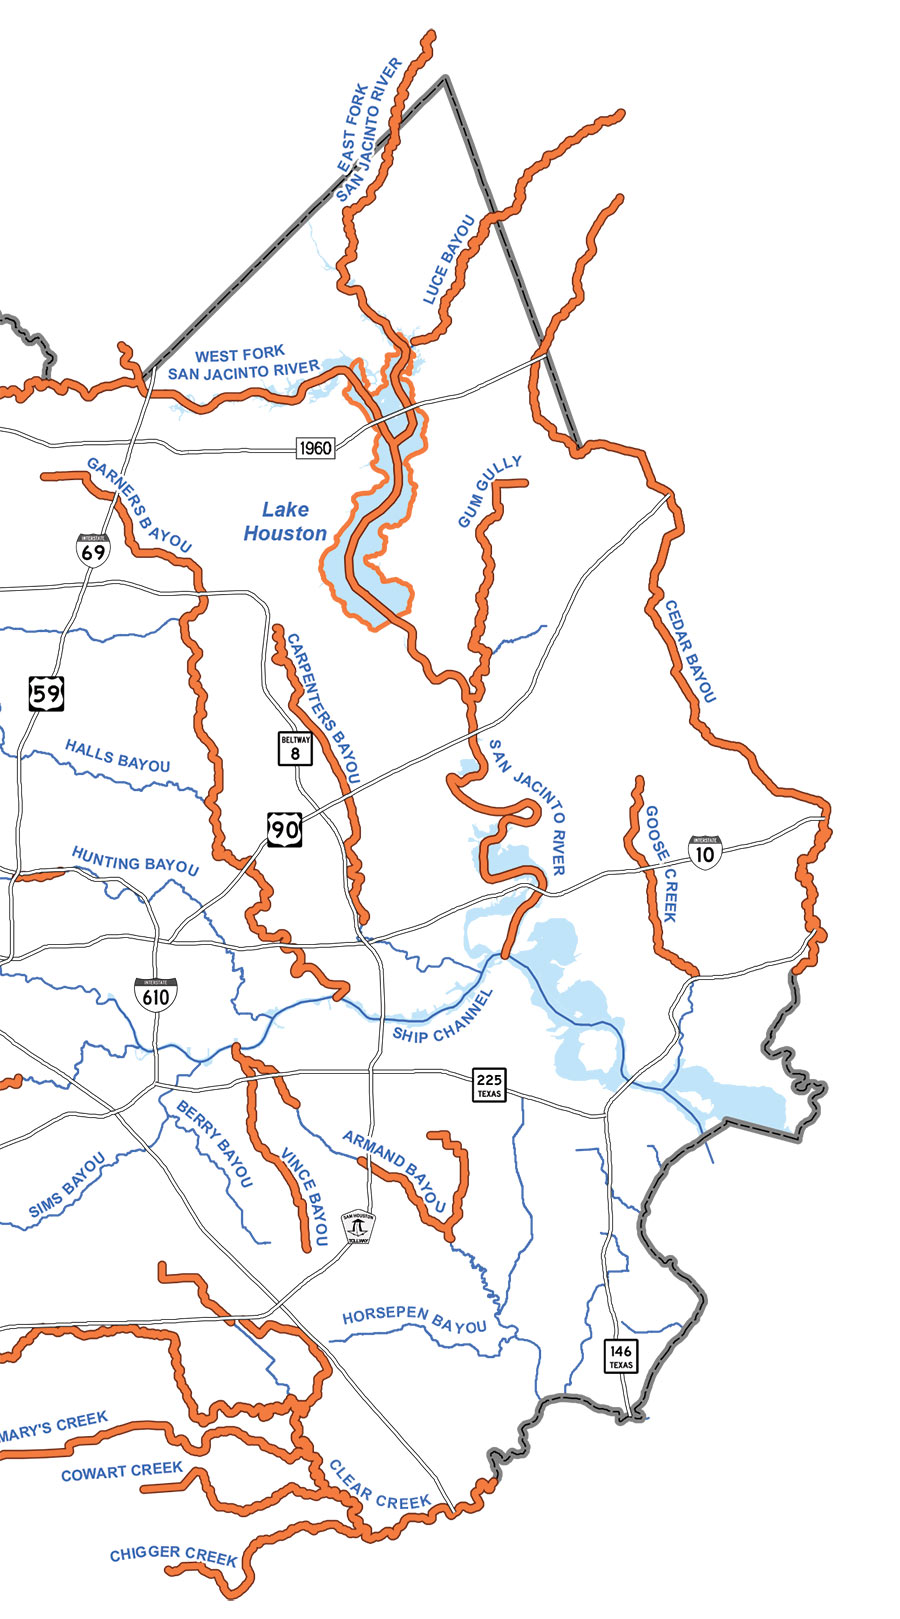
The final page of the Harris County Flood Control District’s final report on Hurricane Harvey includes the map above, with orange indicating where bayous, rivers, creeks, and gullies set new high water marks between August 25 and 29. Aside from Sims Bayou and a handful of smaller waterways, every other liquid landmark in the county outdid itself along some portion during the storm. Several — such as Cypress Creek and Carpenters Bayou (shown in detail above) — set new flood records along their entire lengths.
Less distinguished are White Oak and Little White Oak bayous, which broke records along only tiny stretches near Buffalo Bayou:
***
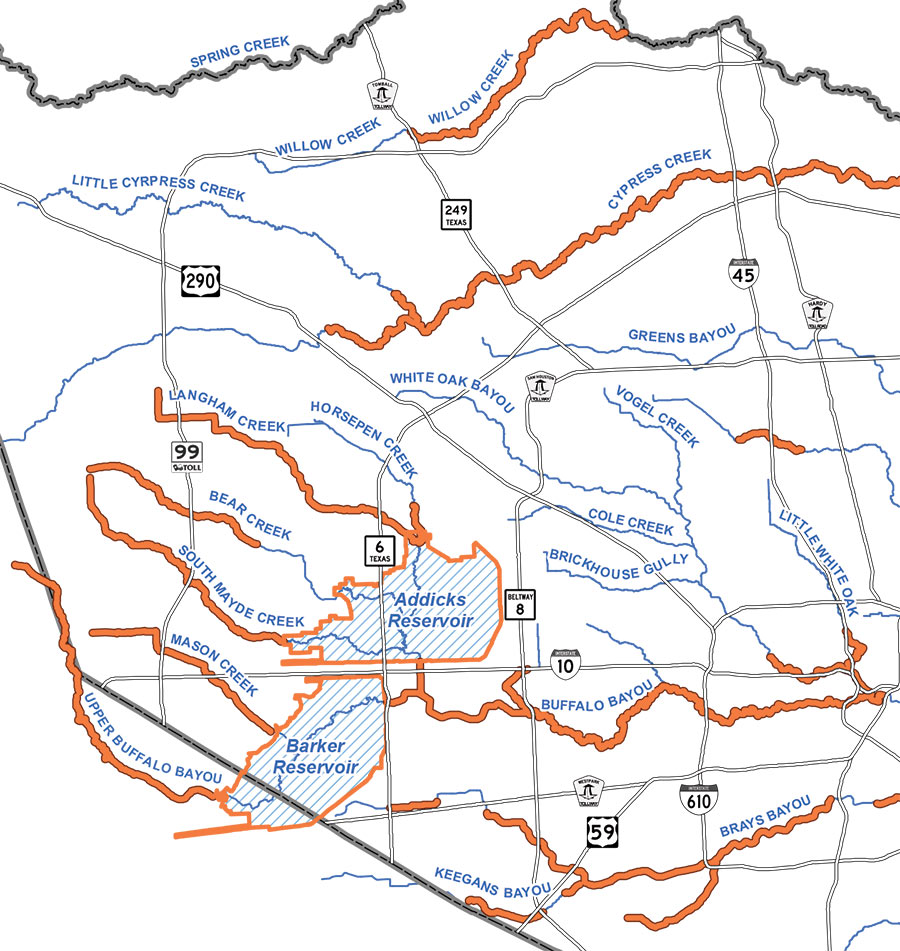
Not that they didn’t still rise high in other parts:

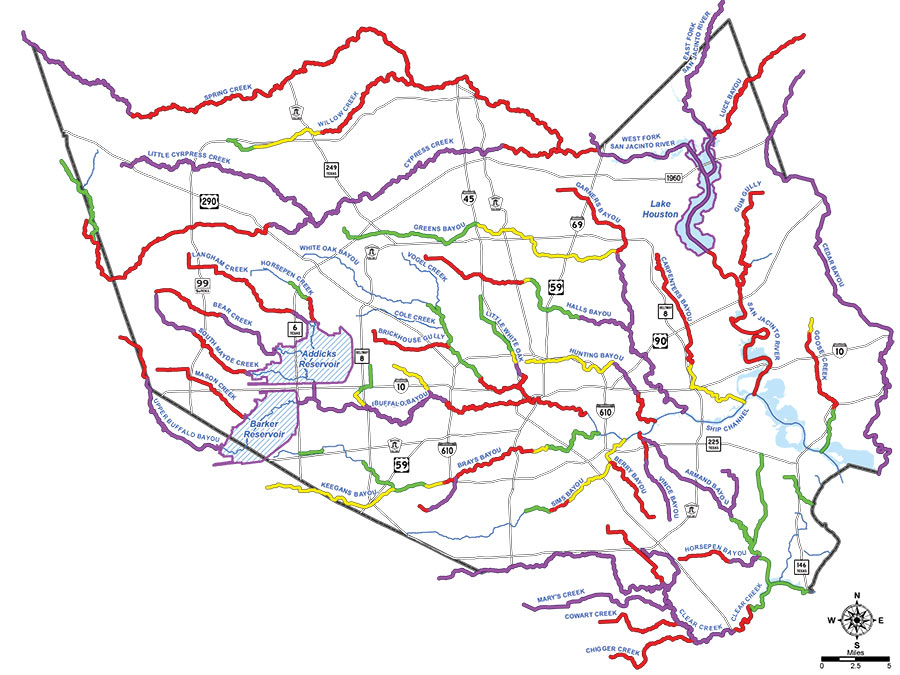
On the second to last page of this week’s report, a more detailed and colorful graphic spells out the unlikelihood that the each stretch of waterway would flood as much it did during the storm:
- Hurricane Harvey [Harris County Flood Control District]
Maps: Harris County Flood Control District



At some point we’re going to need to revise maps to point out that what was 100 year and 500 year are becoming now more like 20 year and 100 year, with new 500 year plains being designated. Too many impervious surfaces combined with more and more excessive storms. It was 18 years from Allison that Harvey happened. The timelines have changed! What will Houston look like in another 20 years?
The interesting takeaway from this map is that it demonstrates how effective freeways are as chokepoints. Nearly every broken bank begins where it crossed under a freeway. On the opposite side of the freeway, no broken banks. Providing additional drainage under freeways would help.
The concept of 100 year and 500 year flood maps is based on the existing hydrologic model, which is based on recorded rainfall since we’ve been recording rainfall. Consider that Houston had about 2000 people in 1850, almost all clustered on the high ground of the heights and downtown, with occasional small settlements in the rest of Harris county.
So the hydrologic model inputs the recorded rainfall for the last 170 years and extrapolates that to predict the probability of specific rainfalls. Harvey will influence what the high end of those maps looks like, defining upwards what a 500 year storm “could be”, even if Harvey was the 500 year or 2000 year storm for much of Harris County, as since we’ve seen something that big in the 170 recorded years, clearly over 500 years something bigger could happen.
You can note in this report that Allison was a bigger than 10 year event only in specific parts of Harris county not over most or all of it, unlike Harvey. So you can’t say that we’re experiencing 500 year storms every year, only that we haven’t had people living here long enough to know what a 500 year storm looks like (betya it looks like Harvey, as the size of that dwarfs any other rainmaking event in recorded US history…….)
Juancarlos,
Who says we’re experiencing this every year? Also, flooding doesn’t necessarily refer to the absolute rainfall amount, the development is artificially changing the risk from what any hydro model would predict. We need practical effects, which will upset a lot of vested interests, but who likes paying insurance anyway.
Jardinero1, I fail to see your proof of freeway chokepoints …. there are one or two examples, but many more “non” examples that can be pointed out, and even one (I-10 at BW-8) that begins AFTER the freeway. Perhaps those few that you want to point out are more due to other factors.
Lost_In: I know you didn’t say we’re experiencing this every year, but plenty of commenters on this and other sites have said that. I didn’t mean to put words in your mouth.
The impervious surfaces thing is a bit of a red herring given the impermeable clay layer of our soil about a foot down and the general presence of swelling clays, which means once your soil is saturated (which is nearly instant), that it acts just like concrete. I’d suggest the hydrologic model is the more important thing to get right because flooding is an outcome of the combination of rainfall and drainage, not merely rainfall. Look at Project Brays, downstream from where that project has widened and improved Brays bayou, you’re seeing yellow and green on the included map, and the number of structures flooded east of main st along the brays was substantially lower than during Allison. The proposed new FIRM maps for Project brays would suggest much of the Linkwood and other neighborhoods along Brays to the west of the widening would have fared substantially better if the Bayou had been widened before Harvey.
Look at West University. Historically flood prone, including badly during Allison, and yet, once the restrictor was removed on Poor Farm ditch into the Brays, West U fared quite well during Harvey.
Correctly estimate the size of the drainage needed to minimize flooding and make tradeoffs between development elevation requirements and major drainage expansions. You can price the fixes for these problems, if you know what to consider. Harvey, more than anything else, gave a model of a near-worst case that new infrastucture could be planned around. (The Harvey-Ike combo than Eric Berger warned of, with heavy rainfall unable to flow to the gulf because of heavy storm surge is the worst-case).
Juancarlos,
I find your comments interesting because they seem to suggest the solution revolves around the idea that Houston had in the 60’s and 70’s, which was to move the volume of water as quickly to the gulf as possible, hence widening waterways to accommodate greater volume and straightening paths to prevent blockages and reduce backpressure. Counter to this, I’ve heard arguments that revolve around slowing water down to prevent downstream potential flooding, but this would entail handling more runoff upstream, hence detention ponds and tortuous path creeks. Which is correct or is it some combo? I’d also be interested to understand better the effect of mature growth grasslands and forests on water runoff from the swelling clays? Does the greenery have a great effect on water retention? I, and many on here, are very concerned about future victimhood of flooding from local development (especially when your neighbors start building dirt forts around you) and increased rainfall events from climate change. I considered buying a couple of properties last year which I am glad I didn’t as Harvey flooded both of them out. For now, as long as I don’t have new flood maps, I consider it a high risk to purchase anything near a waterway. Thank you for your thoughts!
@WR You are correct, it is not true in every case. But, it is definitely true for Clear Creek at I-45. Brays Bayou at 288, Buffalo and White Oak Bayous as they approach the downtown interchanges, Armand Bayou at Red Bluff Road, and Goose Creek at I-10. It should not surprise anyone that a series of elevated, concrete armored berms would slow the egress of flood water.
What this map does not show is that there are over 130 bridges over these channels that are below the 500 year flood plain, and over 100 that are below the 100 year flood plain. There are several areas of town where the alone was probably sufficient to cause extensive flooding.
Those bridges don’t act as “choke points†but are effectively dams.
Jardinero1, How many of these occurrences are actually from drainage projects improvements downstream from these crossings? Typically the drainage projects stop at major highways and they always improve the downstream areas first. I am not saying some low bridges do not exist, but in general I think your “chokepoints” could be misinterpreted …. maps alone do not tell the entire story, but only point out areas to investigate further with an open mind.
@txcon We are haggling over semantics(chokepoint vs dam). I think that we can agree that concrete roadways built on a berm both hold back and channel the water to a finite number of holes where the water can then pass. The number and size of the holes determines how high the water might rise upstream. In the absence of the roadways, the flood patterns would be different.