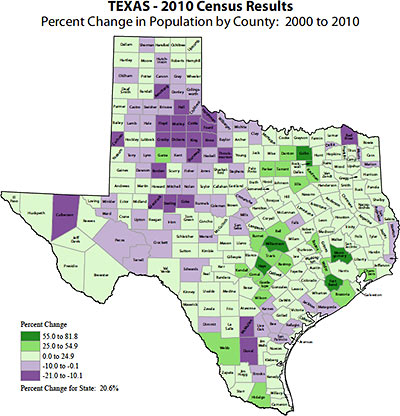
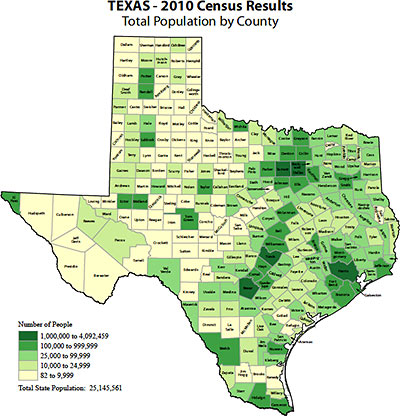
Houston’s population grew by just 145,820 over the last 10 years and now stands at 2,099,451, according to the U.S. Census Bureau, which released some Texas data from the 2010 Census today. The City of Houston’s 7.5 percent population growth rate was lower than the double-digit rates achieved by San Antonio, Austin, and Fort Worth, but still ranks ahead of the city of Dallas, whose numbers barely budged. (From 1990 to 2000, Houston’s population increased by 19.7 percent.) It’s a slightly different story for the surrounding areas: Harris County is still the most populous county in the state by far, growing 20.3 percent since the last census, to 4,092,459. But nearby Fort Bend, Montgomery, Waller, Brazoria, and Chambers counties all grew faster. Fort Bend County’s 65.1 percent growth rate over the last 10 years ranks it as the second-fastest-growing of the largest 20 counties in the state (Williamson County, north of Austin, is filling up faster by only a few percentage points.)
***
.
- U.S. Census Bureau Delivers Texas’ 2010 Census Population Totals, Including First Look at Race and Hispanic Origin Data for Legislative Redistricting [U.S. Census Bureau]
Images: U.S. Census Bureau



Any city-level numbers out yet? Namely, how bad was Hurricane Ike on Galveston?
Actually, the City of Houston has a population of 2,257,926 based on 2009 numbers.
I could be missing something? But I doubt the actual number this year is down 200,000 people from last year?
Post the link that gives the population of Houston, if you could, please?
In looking into the numbers further, I’ve come to the conclusion that the US Census Bureau has no idea what its doing!
To over estimate by 200,000 people, is inexcusable! So for the past 5+ years we’ve all thought we had an additional 150 – 200k people living here?
What’s the margin of error? +/- 100,000!
I often see fluid dynamics in other things – for instance, the ‘Population Change By County’ graphic.
Imagine this map is a pool. Pebbles of population have been dropped on Dallas, Travis and Harris counties, homes of TX’s largest cities. Deep blue (+25% pop. growth) spot resulted on the map.
Now the 2010 census shows the first rings around those drops’ splashes: Contiguous, surrounding, sprawl counties that are growing faster than the previous centers of population. Old centers are calm. Shrinking even?
How may Telecommuting or High-speed Rail affect the number of census-rings (population expansion rings) before the energy is reflected back to the city-centers by economic dead-zone barriers? What will define those barriers? Or will technology and planning encourage unlimited census-expansion rings?
Bear in mind Eric that the 2009 US census number was estimated based on the increase between the 1990 and 2000 census. Actual counts are only taken every 10 years.
Does the fact that it is below 2.1 million (even though it is by tiny margin) mean the City does not need to add two new districts as mandated in city charter? Will make redistricting much easier.
@ Movocelot: You’re looking at maps that indicate total population by county and percentage change by county, not maps that indicates absolute numerical change or population density within counties of varied size. So yeah, there’s pretty much nothing that you’ve said that is supported by the evidence in this post (although that doesn’t mean that everything you’ve said is wrong).
What we really need is a map that displays changes to population density by block group. Unfortunately, the Census Bureau doesn’t work that way and the press is lazy, intellectually overwhelmed by color gradients.
I’m still amazed that Houston (proper) only added 150,000 people in the last decade! It sure seems more crowded than before, and I know people from the burbs don’t account for all that activity!
I wonder how many people weren’t counted in Harris County?
Yikes! I’m moving to Loving County. Population 67.