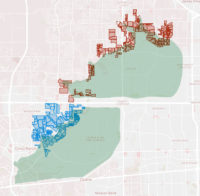
COMMENT OF THE DAY: THE MORE WEST HOUSTON FLOODS, THE MORE IT STAYS THE SAME  “Why does it matter? Even after the flood, I am okay with them building there on private land. Flood risk is just one of a million things that you should look at when buying a home. Heck, even knowing what we know now, I might still buy there in the right situation. If I was looking to buy a home in that general area, and the only way I can get one is to build one on the far back end of the reservoir, I would still do it today. Even after we calibrate the models to include the recent rainfall events, we will still find that this is an outlier.” [Rex, commenting on How It Came To Pass That Hundreds of Families Purchased Homes Inside Houston’s Reservoirs; previously on Swamplot] Map of subdivisions in or along the edge of the Addicks and Barker reservoirs: ProPublica
Tag: Reservoirs


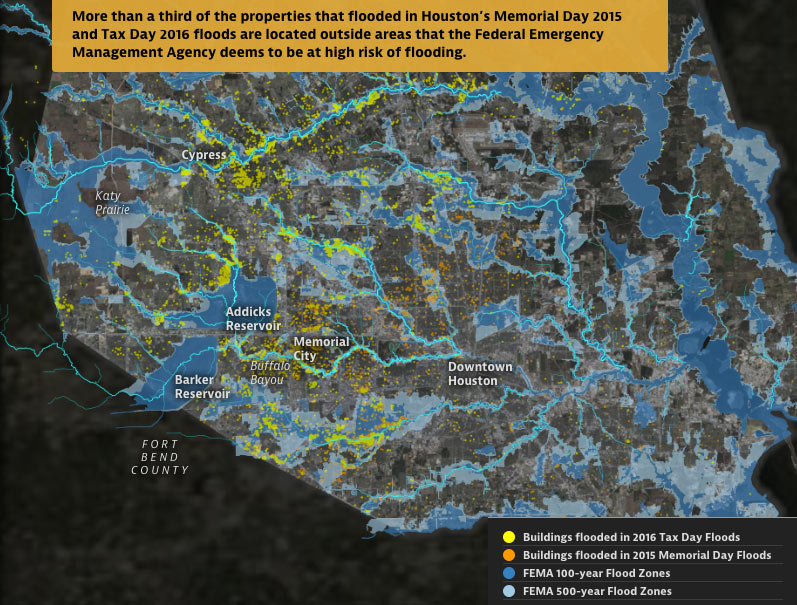
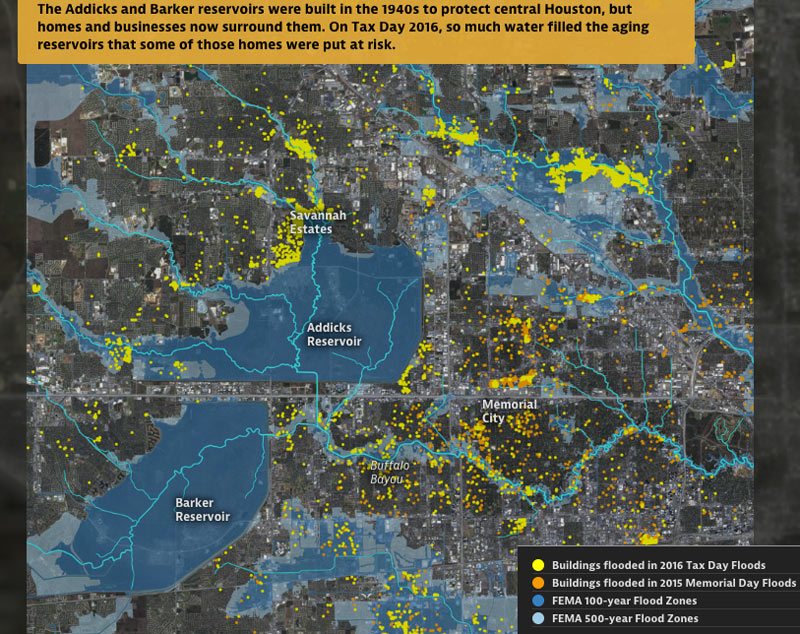
From some of the same folks who brought you those fun-with-worst-case-scenarios hurricane flood maps earlier this year —  Neena Satija and Kiah Collier of the Texas Tribune, and Al Shaw of ProPublica — comes a fresh set of animated maps of a few of Harris County’s most flooded and floodable places, along with a bit of investigation into how they got that way (and whether that might change any time soon). The new illustrated presentation shows off the spread of properties that took a dip during some of Harris County’s last few citywide submersion events (flooded properties from Tax Day 2016 are shown in yellow above, along with the Memorial Day 2015 flooded properties in orange).
Texas A&M Galveston researcher Sam Brody tells the authors that “more people die here than anywhere else from floods. More property per capita is lost here. And the problem’s getting worse.â€Â In sorting through some of the whos, whats, and hows of Harris County’s flood infrastructure and chronically soggy residents, the article juxtaposes the recent flood damage data with the likes of FEMA-mapped 100- and 500-year flood zones (shown above), a visual tally of the land area developed last decade, and a view of what’s left of Houston’s coastal prairie (as of 2010):

