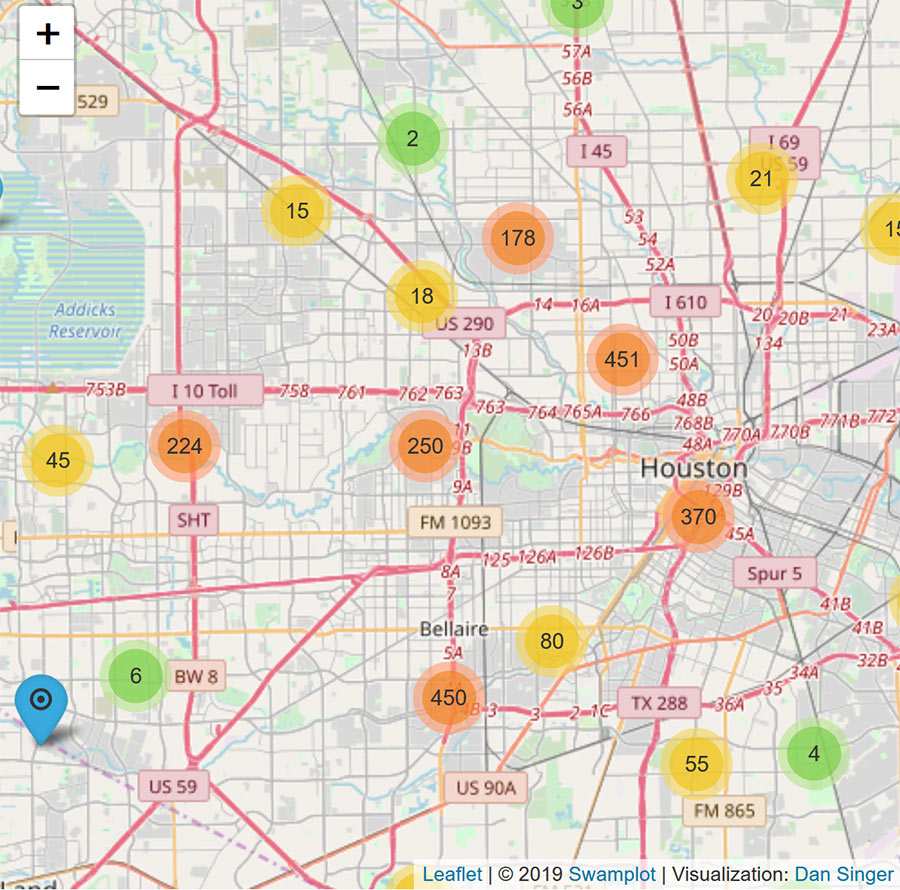
Update, November 22: The finalized county precinct data has been incorporated into the map above; a layer showing voter turnout has been added as well.
With all 1,012 precincts shaded in by civic data whiz Jeff Reichman, the interactive map above of last week’s election results shows both stark splits and gray areas in blue-swung Harris County, which gave only 41.8 percent of its vote to Wrestlemania hall-of-famer and historically litigious president-elect Donald Trump. The red-to-blue shading shows who won by what percentage, with results ranging from count-’em-on-one-hand margins to total blowouts for one major candidate or the other. You can click on each precinct to see the breakdown of votes and turnout (though Stein, Johnson, and McMullin voters will have to look elsewhere for the details on those candidates’ spreads).
On the east side of town, the red-blue divide runs roughly along the track of Beltway 8; the border of that central dark blue zone stretches north to include Greenspoint and then runs east along FM 1960 to 290. The split gets murkier on the west side of the Inner and Outer Loops, with many precincts showing much closer margins. More noticeably red areas inside Beltway 8 show up near Memorial, River Oaks, Bellaire, and Shepherd Park Plaza — plus spots like tiny Precinct 0830 on S. Main, where Trump took a total of 3 votes to Clinton’s 1.
- Previously on Swamplot:Â Where Houston’s Trump and Sanders Supporters Are Clustered, and Other Election Data Mapping Fun
Map of presidential election results by precinct: Jeff Reichman


18th congressional district represent! If someone could overlap the two maps its nearly an identical overlap with the dark blue areas. God forbid the democrats ever lose their incongruent voting bases or these high urban numbers are going to tank.
Summary: Trump promises return to good old days for white people, white people like the sound of that.
yawn, how utterly and completely unsurprising
The gentrification arrow is definitely showing.
I voted for Trump for the lolz but now that he actually won I feel like a practical joke seriously backfired and one guy ended up with a broken leg and the rest of the squad got 40 hours of community service.
@Mr.Clean19 that’s the Anglo Arrow, and it’s been there for decades, long before gentrification.
.
And yes, this demonstrates the common narrative about this election – it was rural and rural-leaning suburban whites vs. everyone else. Particularly prominent in Texas as white cultural mythology is pointed to the countryside.
@Memebag Eh, not entirely. To the best of my knowledge Montrose, Rice Village and the Heights are predominantly white areas of town, yet they voted for Clinton.
Not surprised the colors of River Oaks vs Memorial…Trump is trés nouveau. Who in 77019 would vote for a bridge-and-tunnel “billionaire”? The gilded McManions in the villages on the other hand….
And 98% of black people voted for Barry, twice.
Memorial villages and River Oaks sticking out like sore thumbs….
Would be good to see Fort Bend County on this map as well, it also went blue.
How do you get 200% voter turnout? That was the turnout percentage of the mentioned Trump-winning South Main precinct.
Is anyone else surprised about West U though?
.
I’ve always assumed they’d be deep red in line with all the other single issue neighborhoods (cuts to income tax rates) like memorial, river oaks & bellaire. Are incomes really that much lower in West U or do they just have a much more diversified demographic base?
@joel, West U is the 35-to-45-year-old married couples with two six-figure incomes from middle management positions. River Oaks and the Memorial villages are oil money and/or seven-plus figures.
@joel, West U also has lots of transplants from the coasts.
Turning_Basin sees the obvious and misinterprets it: the ridiculous shape of the local congressional districts has no bearing on the strong Democratic vote in Harris County. If gerrymandering ended and those districts were recast along—what the heck—geographic lines, the effect would be to gut Republican congressional representation from this part of Texas (and probably other parts too).
If the districts were less egregiously gerrymandered, then the primaries wouldn’t nominate such extreme candidates.
The 4 votes cast in 830 mark 200% turnout. If you google map/view the area I can’t imagine where someone might live
@Houstonreader – Gerrymandering serves a purpose and it can be positive, negative, or neutral. It can group like constituents to either allow them to have a collective voice or to suppress it. I think your comment is misleading and inaccurate. Harris county has 5 congressional seats. For Harris county 3 of the 5 went to democrats (60%) while only 54% voted for Hilary and 53% voted straight Democratic party. Data supports the gerrymandering as neutral despite your opinion.
http://www.harrisvotes.com/ElectionDayresults.aspx
@Eric and @Bill Shirley, it’s actually infinity% turnout, because the only two voter registrations listed for precinct 0830 are in SUSPENSE status. Oh wait, never mind; I just confirmed that voters who have chosen to be removed from the website search also do not appear in the downloaded lists either.
I love the “White people voted for Trump”. Or “Trump is only for white people!”.
.
White people voted about 50/50 for Trump. If you want to look at a skin tone that votes in a monolithic block, it’s black Americans (I hate the term African American as it seems presumptuous to assume someone with black skin is from Africa. And one of my good friends is white, and from Africa. So he’s “African American’ for real yet doesn’t fit the image. Anyway).
.
It’s always a bid saddening when people vote along color lines or sex or even LGBT or not since the various issues that exist that might cause you to vote for one person or another have nothing to do with either of those things.
oh no cody, does it really make you sad? :(
actually, if you want to be more accurate, white isn’t the significant category that elected trump because college educated whites, females, people under 44, people with incomes less than $50,000, people who live in cities, gay, unmarried, and atheists actually voted significantly in favor of hillary. so if you’re looking for someone to blame its those dang uneducated, straight, christian, rural, elderly single white males that are to blame.
http://www.nytimes.com/interactive/2016/11/08/us/politics/election-exit-polls.html
Hi all! The County Clerk’s office says the turnout for 0830 is currently listed as 200% because “three other precincts were combined along with the provisional ballots that are pending and currently being processed;” once the results are fully finalized the number will change, and we’ll post an updated version of the map. Thanks for the feedback!
@spiteful Your comment is only half true. People from all those groups from ~20% to 49% ALSO elected Trump. I support neither but Clinton lost significant ground on your imaginary voter of “college educated whites, females, people under 44, people with incomes less than $50,000, people who live in cities, gay, unmarried, and atheists”.
“It’s always a bid saddening when people vote along color lines or sex or even LGBT or not since the various issues that exist that might cause you to vote for one person or another have nothing to do with either of those things.”
.
umm, yeah, being denied equal rights and access to the same civil liberties as that of the majority has a tendency to do that. how selfish of those minorities.
@Hey Hey Houston: you go wrong in deciding fair congressional apportionment on the basis of the vote for the most recent presidential candidate. And you go wrong in equating the borders and voting patterns of Harris County with its local congressional districts. To take some examples, TX-18 goes well outside the borders of Harris County, as does the 22nd, as does the 9th.
.
And then, if you’re defending gerrymandering, you’re doing a poor job of it by telling us what we already know and by not acknowledging that your “positive, negative, or neutral” are all in the eye of the beholder.
.
It is hardly misleading to offer an opinion, as I’ve done, but to play sloppily with the data, as you do, now that’s misleading.
@Cody: black Americans have regularly voted for presidential candidates of other than their own race since 1860s until today. In 2008 and 2012, they had the rare opportunity to vote for someone of their own race. Many of them did, and you feel disappointed in them for having done so? You should consider that it may have been Obama’s policies versus McCain’s that accounts for some of their voting.
.
And you should be prepared to acknowledge that Trump’s relentless race-baiting must account for some of his support. The fact that that doesn’t register with you is remarkable.
@Houstonreader – Your opinion that Houston has ‘a strong Democratic vote’ is inaccurate which is baked up with data. Significantly worse so if to you look at further history. 2 of the 3 districts mentioned were won by Democrats.
.
One man’s positive is another’s negative so it works out.
.
I don’t really see what you are complaining about here. Do you think you think all of the Reps from Houston should be democrats and none of the 40%+ of republican voters shouldn’t be represented? Please continue to live in your bubble where Houston is a complete progressive utopia in Texas.
@Hey Hey: you’re now arguing against a straw man—unless you can find me saying that Republicans don’t deserve representation in local districts, much less mentioning a “progressive utopia in Texas.”
.
Clinton beat Trump by more than 12 points. In spite of your quibbling, that’s a “strong Democratic vote,” and nothing you’ve said has contradicted my point about gerrymandering or Turning Basin’s interpretive error.
.
Enough time wasted.
I would like to see this for the cities in all of America as well as down ballot blue red splits.
@Randall Baxley, here’s a map for Virginia. You can drill down into each county or independent city and then into each precinct. Hovering over a precinct displays a tooltip with the number and percentage of votes for each candidate.
http://www.vpap.org/electionresults/president/
So, I was curious why you picked on Bellaire, which I know is not very conservative. Take a look at the facts. Is it really fair to name Bellaire this way? Bellaire is comprised of 5 voting precincts. When you combine the votes of the 5 precincts, the total for Clinton was 4840, Trump’s was 4134. In other words, Clinton won with 54%. Not only is it not fair to lump Bellaire in with River Oaks and the Memorial Villages, it’s not even remotely accurate. What about wealthier West U? It has only 3 precincts, and their totals are 3085 for Clinton and 2751 for Trump. Again, Clinton won, but with 52.9%–more than a percent less. Why then pick on Bellaire? Is it because you don’t know the geographic boundaries?
Hi silent e! Thanks for the feedback! The intention was just to highlight some areas inside the Beltway that skewed less toward Clinton, in comparison to the solid dark blue block on the east side of town — we updated the language from “more definitively red” to “more Trump-leaning” to clarify this. Note that we only said “areas near”, rather than listing off each specific neighborhood where the margins got close or tipped to Trump; for example, we referenced the area near Shepherd Plaza instead of teasing apart all the Garden Oaks/Oak Forest-proximal precinct nomenclature. We picked Bellaire as the general hey-look-over-here reference for that sector of the map because of Precinct 214 (which is in Bellaire, and is one of the few precincts in that closer-margin block south of 59S that did tip fully into the red).
Wow, I’ve played with this map several times over the last week and only just now noticed that you can color-code by candidate or by percent turnout or both. If you look at turnout instead of candidate, the “gentrification arrow” really stands out.
@commonsense RE: the presidential election,
You’re a dope