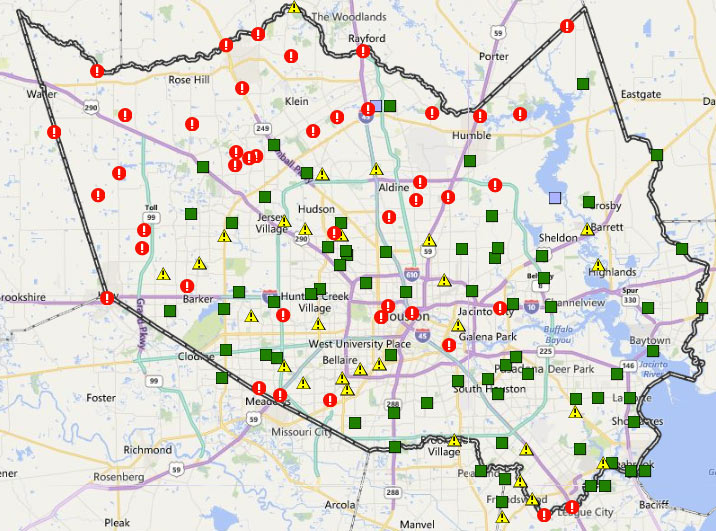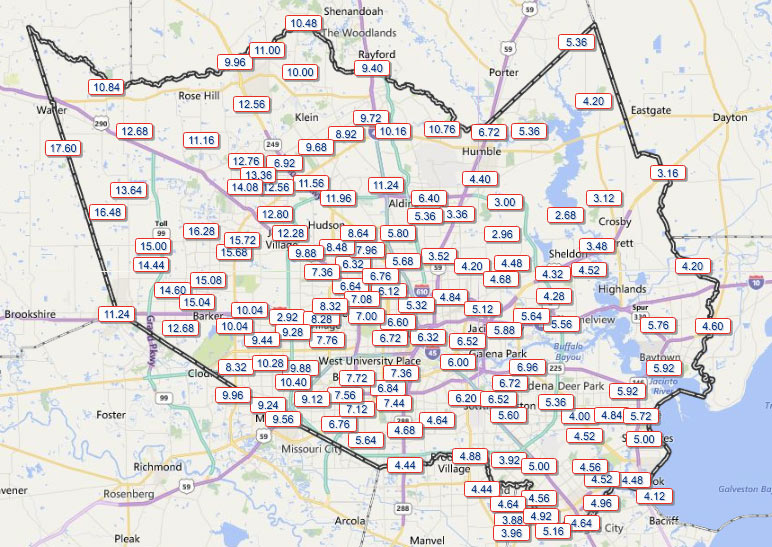
The many exclamation points scattered across the map of Harris County above mark spots where stream channels are currently overtopping their banks (in red!) or potentially thinking about it (in yellow!). The capture comes from the Harris County flood warning system interactive map, which automatically updates data from its county-wide network of rain and flood gauges every 5 minutes. Most of the current overtopped locations are concentrated toward the northwest areas of the county, parts of which got more than 17 inches of rain since Sunday morning. The green shapes mark channel gauges that aren’t currently at spillover stage or close to it (whether or not any spillover occurred earlier today).
The county’s online map also shows cumulative rainfall across the area — here’s what the totals look like across town for the last 24 hours:
***

Maps: Harris County Flood Control District Â


How do I get the streams and bayous red and yellow marks? All I can see is rainfall totals.
Hi Robin! You can use the pulldown menu on the left hand side to toggle between “rainfall” and “channel status” views, under the “Map View Options” header.