01/03/19 3:00pm

It’s the most wonderful time of the year to take stock of everything that’s been ripped to shreds around town recently, so we built this tool to help you do so. The map above shows the location of every demolition permit filed with the City of Houston in 2018. Here’s a full-size version. In total 2,312 properties were tagged for demo, some of which — like, say, apartment or industrial complexes — saw multiple structures go down on their premises. Zoom in and you’ll see the clusters start to break down into individual address markers that tell you more about what went down. (Multi-building demos are indicated by the bullseye icons with multiple rings.)

Recognize any of last year’s high-profile disappearances? The Shelor Motor Company Building at 1621 Milam St., for instance? KHOU’s flooded newsroom at 1945 Allen Pkwy.? The Depression-era Harris County District Attorney’s Building at 201 Fannin, Clark Gable’s former house at 411 Hyde Park Blvd., the northeast portion of the River Oaks Shopping Center at 1958 W. Gray St., La Colombe d’Or’s ballroom at 3410 Montrose Blvd., architecture firm Caudill Rowlett Scott’s former HQ at 1177 West Loop South, Exxon Chemical’s old conference building at 13501 Katy Fwy., the mysterious Heights corner compound at 620 W. 9th St., Shake Shack’s Burger King predecessor at 1002 Westheimer, the last traces of KBR’s Fifth Ward complex at 2720 Clinton Dr., the bungalow at 610 Allston St. where Mary Cerruti — the homeowner who refused to make room for Trammell Crow’s adjacent Yale at 6th apartments — was found dead inside one of the walls?

They’re all there. This time, however, they’re sharing the spotlight with all their fellow, but significantly less fussed-over knockdowns, the kinds that form the bulk of Houston real estate turnover. For a look at where across-the-board demo activity was the most concentrated last year, take a look at our 2018 demolition heatmap:

CONTINUE READING THIS STORY

Annual Demolition Report
04/12/17 12:45pm

Super Bowl Alcohol Sales Boost Map

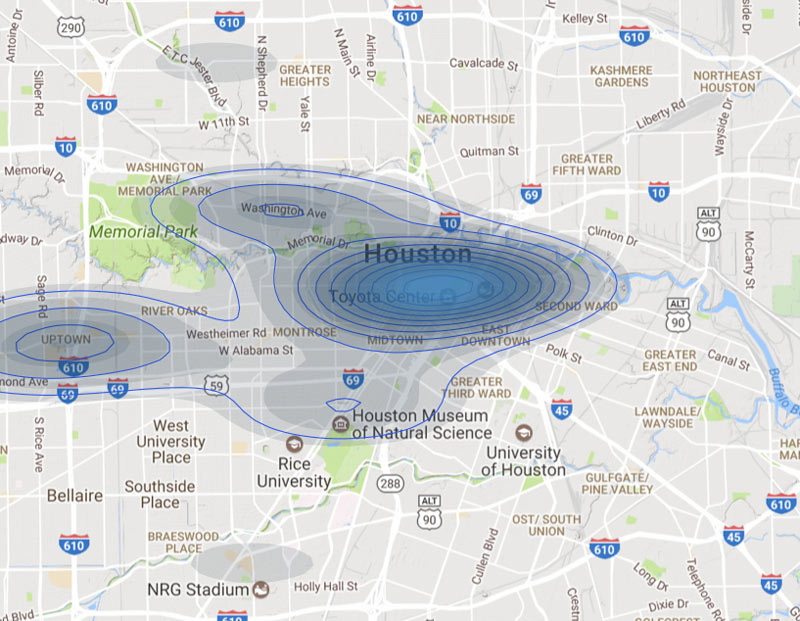
“I can’t explain how a Chili’s got on the list, but that Chili’s must have been pretty lit,” writes engineer and bar aficionado Ian Wells. Wells just wrapped up his latest data-crunching escapade: a dive into how much extra alcohol sales revenue was actually pulled in by Super Bowl LI (as well as where that boost was distributed and who bagged most of the excess). The map above gives an idea of how the $8.9 million in extra alcohol sales (plus or minus a couple million) were spread out around town during February; Wells notes that probably only 5% of establishments saw more than a $25,000 boost above what they would have made in a normal February, though there’s lot of uncertainty in modeling any given bar’s expected “normal” revenue.

So who got the biggest percentage sales bumps? Here’s the rundown through the top 10, and some highlights from the top 100, plus more on where all those numbers come from:

CONTINUE READING THIS STORY

Crunching the Numbers
09/01/16 5:15pm

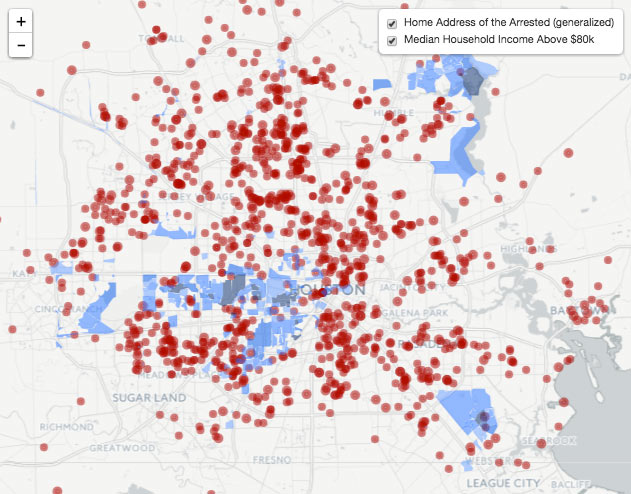
Map of Weed Arrests in Early 2016 by Home Address, Superimposed over Median Incomes Greater than $80k

Is there a connection between where you live and your likelihood of getting arrested for weed in Houston? A map from January Advisor’s (and Sketch City‘s) Jeff Reichman adds a few data points to that conversation this afternoon, though he doesn’t appear to push any specific conclusions in his how, what, and why writeup. Reichman gathered data on the folks that Harris County’s public jail records system says were arrested over the first half of this year for minor marijuana possession offenses (instead of just being given a citation for the same offense). The red dots on the interactive map show the arrestees’ home addresses (scootched around a bit to somewhere within the dot’s 300-meter radius, for the sake of anonymity).

The other data layer (in shades of blue) shows census blocks with median income over $80,000 (marking roughly the start of what the US census measures as the top quarter of household earnings in the US, Reichman notes). The blue areas, which get darker as income gets higher, appear relatively arrest-free, though a 2012 study from the NIH suggest that more frequent weed use may be linked to higher socioeconomic status.

Map: Jeff Reichman

Mapping the Green
05/27/16 3:00pm

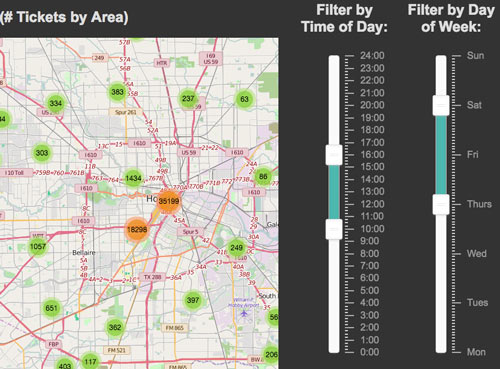
NEED SOME HELP WITH THOSE 268,942 MAPPED HOUSTON PARKING TICKETS? Ticket Map Interactive Tool by Jordan PolesAmateur parking violation scrutinizer Jordan Poles has another new tool for those interested in the where- and when-abouts of parking citations in Houston. Each ticket from the same data set used in Poles’s earlier heat maps is now mapped individually (though thick clusters condense to single group markers at most zoom levels, since there are hundreds of thousands of tickets in the 2014-2016 dataset he uses). So far, the page lets users filter the tickets by time of day (sliders allow any hour-to-hour subdivision of a midnight-to-midnight window) and day of week (running Monday-through-Sunday); Poles plans to keep upgrading the site and to add new analytical features and datasets. [Previously on Swamplot] Image: HOU Interactive Parking Ticket Map