
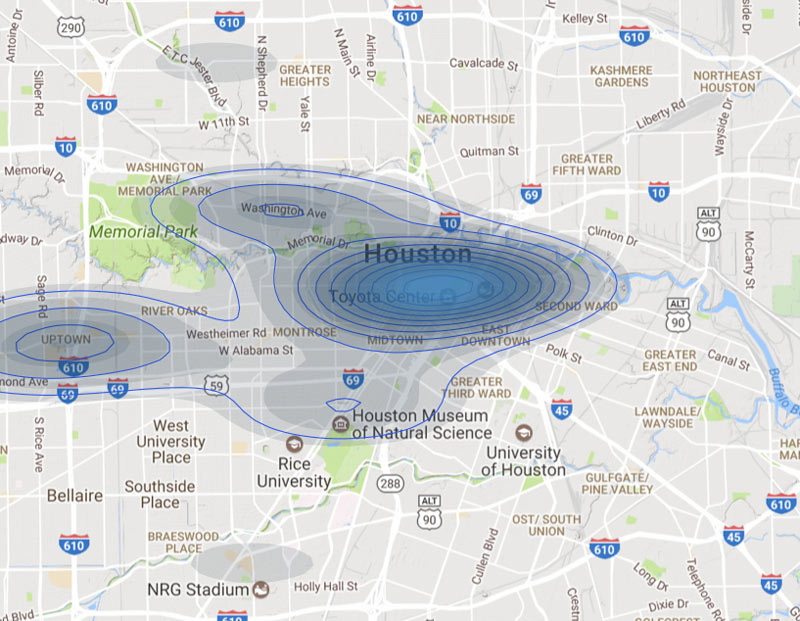
“I can’t explain how a Chili’s got on the list, but that Chili’s must have been pretty lit,” writes engineer and bar aficionado Ian Wells. Wells just wrapped up his latest data-crunching escapade: a dive into how much extra alcohol sales revenue was actually pulled in by Super Bowl LI (as well as where that boost was distributed and who bagged most of the excess). The map above gives an idea of how the $8.9 million in extra alcohol sales (plus or minus a couple million) were spread out around town during February; Wells notes that probably only 5% of establishments saw more than a $25,000 boost above what they would have made in a normal February, though there’s lot of uncertainty in modeling any given bar’s expected “normal” revenue.
So who got the biggest percentage sales bumps? Here’s the rundown through the top 10, and some highlights from the top 100, plus more on where all those numbers come from:
***
Other than a couple of slots held by Aramark (i.e., the brand that served drinks at NRG and most of the official Super Bowl events around town) and various hotel bars (those at the Hilton Americas, the Four Seasons, and the Memorial City Westin), the top 10 list includes Underdogs Sports Pub (a Wash Ave bar which got in on the sales action at Club Nomadic), B&B Butchers (also located near Club Nomadic), Clé Bar, and — filling in the number 10 spot — Westheimer strip club Treasures, fresh off its most recent legal tangle.
Other spots floating around near the top of the list include the likes of Axelrad, the Men’s Club, Hotel ZaZa, and, yes, a Chili’s — apparently the one inside IAH. Wells also checks how many of the most heavily boosted bars are actually local Houston earners; per his analysis, 8 of the top 20 on the list are from out of town companies.
Wells uses 6 years of pre-Super Bowl TABC sales data to create a model of expected alcohol revenue for a hypothetical Super Bowl-free February 2017;  he then compares that estimate to the actual sales numbers from the TABC’s tax collection records to see who got the biggest percentage sales bump. For those of you playing along at home, details on methodology and code are written up here for your perusal, along with the rest of the top 100. Wells illustrates his analysis with lots of charts and graphs, even using Poison Girl’s numbers to illustrate what a major Super Bowl spike doesn’t look like.
- Effects of Super Bowl LI on TABC Revenues in Houston [Ian Wells on RPubs]
- Previously on Swamplot:Â Steering Clear of the Super Bowl Crowds, Whether They Show Up or Not
Images: Ian Wells
The gentrification arrow appears again.
Talk about an outlier! The Bell Tower on 34th must have had some bitchin’ parties booked!