


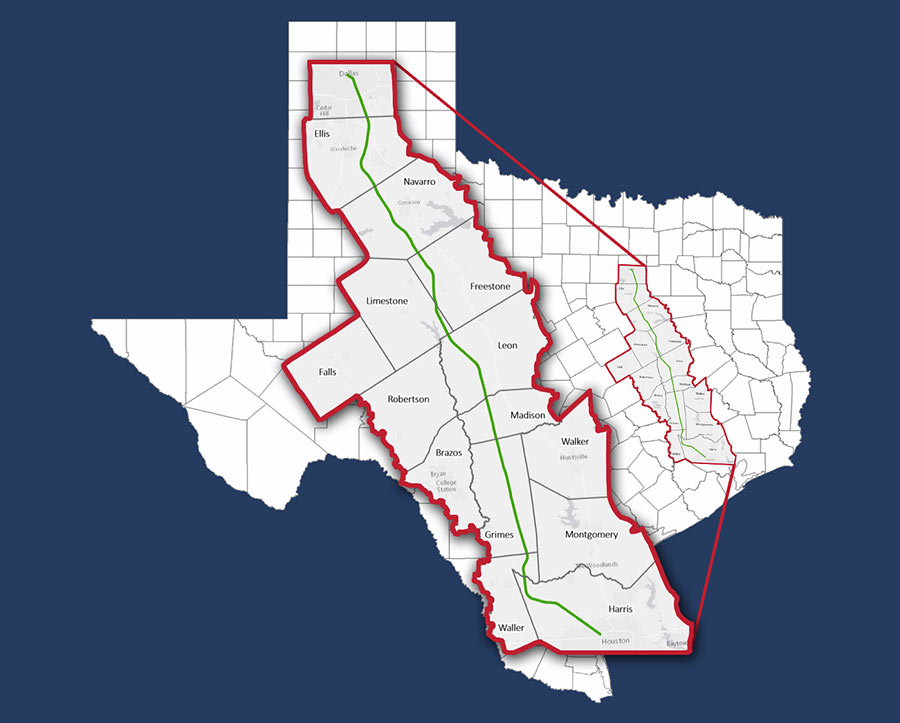
The Center for Neighborhood Technology has updated its interactive region-comparison website to show data comparing carbon dioxide emissions around the Houston region. The Housing + Transportation Affordability Index now allows you to compare CO2 emissions — from “household vehicle travel” only — on side-by-side zoomable maps.
The 2 new data sets available show CO2 emissions per acre (at the top above), and CO2 emissions per household (directly below that) from household auto use. The Houston-Galveston-Brazoria region is one of 55 U.S. metropolitan areas mapped on the website. The center’s point?
When measured on a per household basis, it found that the transportation-related emissions of people living in cities and compact neighborhoods can be nearly 70% less than those living in suburbs.
The center figures that transportation accounts for 28 percent of all greenhouse gas emissions in the U.S.
Other H+T map tools focus on how affordable different locations are to live in — when you take transportation costs into account:
***
One preset on the site compares projected annual household gasoline expenses, using 2000 and 2008 data. A more interesting one compares housing costs across the region with combined housing-and-transportation costs:

But the real fun begins in the last section, where you can build your own comparisons of a couple dozen different sets of data, including the number of autos per household, household density, travel time to work, average monthly rent, and housing and transportation costs as a percentage of income for owners and renters.
Our sample setup, where we’ll hunt carefully for geographical correlations between autos per household and average block size:

What do you find when you zoom in?
- H+T Affordability Index [CNT]
- New Maps Show that Urban Living Helps Curb Global Warming [CNT]
- Area outside Beltway 8 contributes most per capita carbon emissions [Houston Tomorrow]
Maps: H+T Affordability Index


manmade global warming = big con
CK, are you a scientist or expert that studies this on a daily basis… or just someone posting their pointless opinion on website’s comment section? I, for one, prefer to listen to the experts on these matters (just like I would expect people to listen to me regarding software development, but ignore me if I claimed that Einstein was full of crap regarding his theory of relativity).
So, when can we start taxing the suburbanites for their excessive CO2 use? That would only be fair.
Looking at the map, I am actually surprised that the Pasadena-Baytown area does not have more emissions.
I’ve worked the technical side of mapping software like this before, and consequently I’m very cautious about what exactly is being depicted. Specifically, I want to know how CO2 emissions per household were calculated. There are a lot of variables that can affect the results, one way or the other. Secondarily, I would ask whether density or income is really the culprit. It seems like there’s a remarkable correlation between the map depicting CO2 output per household and the map depicting both housing and transportation costs as a percentage of income. And while it is true that transportation probably makes up a quarter of all CO2 output, personal transportation by automobile is probably well under a fifth. Wealthier people drive more because they can afford to, but much more importantly, they consume goods that are created through industrial processes in vastly larger quantities and are thus responsible for CO2 output in ways that these maps completely fail to capture.
.
This and other evidence would seem to indicate that the solution to global warming is poverty.
Hmm, guess I’d like to know what they are basing the CO2 estimates on – they are ESTIMATES, right? Those guys didn’t go out & actually measure CO2 anywhere. And this is based on auto use only, correct? Not showing, for example, the CO2 emitted in manufacturing power for buses, trains, etc. that run their routes even when empty. And are they assuming all the folks in the suburbs are coming into the city to work? Are they working with “reported” household auto use or actual numbers?
We statisticians want to know!
My GUESS would be that they used statistics regarding driving habits by block group, and then used an average emission per mile to generate the data behind this map. I seriously doubt they actually took measurements in every census block group! :)
Generalizations are never perfect, but if they took the time to do their research, what they are showing is probably pretty accurate. At least when just cars/homes are considered and no other, more difficult variables to measure are brought into the equation.
Of course if every single person in a suburban census block drives a hybrid or or electric car than this wouldn’t be accurate at all. :)
The expense maps are interesting and not terribly surprising. Consider a family of a couple and two kids; in the suburbs, two or three cars is the norm, whereas in the city, you can function easily and conveniently with one car. Those extra cars mean some hefty additional expenses for car payments, insurance, maintenance, and fuel; so while the housing is more expensive in the central parts of the city, the extra mortgage/rent payment can often be offset (& then some) by reduced transportation expenses.
John writes: “…whereas in the city, you can function easily and conveniently with one car.”
I have a co-worker who lives just outside the loop. His kids are grown and out of the house so he and his wife are trying to get by with just one car. Frequently one of his transportation strategies seems to be either to borrow my car or ask me to give him a ride somewhere. I’m glad I can be such a good colleague and help him save so much money on transportation… :-\
Brian, the real “experts” in climatology and meteorology vastly agree that man made global warming is all BS. Those pushing the big con are passing off junk science as factual information. Follow the money trail to learn the true reasoning behind people like Algore.
Just one of many examples …..
http://www.weeklystandard.com/Content/Public/Articles/000/000/016/591lnajh.asp
CK… Did you seriously just ask me to “follow the money” trail and then post a link an article on the conservative Weekly Standard? Wow.
Brian
It’s snowing in ND in June
http://www.kxmb.com/News/Local/386720.asp
And Brian, please disregard the giant ball of fire in the sky as having anything to do with the global climate…b/c that would be completely preposterous…
And also disregard the coolest sunspot activity in a decade and the associated change in the global climate (not in favor of a global warming claim)…
And why are THEY referring to it now as climate change instead of global warming?
And, suddenly, now that the political agendas associated with global warming have been pushed to the side by bigger issues we’re seeing that most credible scientists and climatologists (who don’t work for those with agendas) are increasingly discrediting global warming. Hmmm…
..And Toyota Prius’ sales are down 45%
(not that that proves/disproves anything)
And what about that global cooling thing in the 70’s…I wonder what happened to that?
And you might want to revisit that whole ice-sheets-falling-off-Western-Antarctica-at-an-overwhelming-rate…THEY forgot to mention during that same time period that the rest of Antartica added more ice that any time in recorded history therefore offsetting the record losses on one part of the continent…
And please throw out your copy of Al Gore’s nonsense. Statistics are a funny thing when one has a significant political agenda…
Oh…and pull your head out of your ass and learn to read between the lines of BS that’s force fed to us…
Just another Sheeple…thanks for keeping the idiots in charge
Four years ago the then President of Shell Oil said “We have to deal with greenhouse gases. From Shell’s point of view, the debate is over. When 98 percent of scientists agree, who is Shell to say, ‘Let’s debate the science’?”
Exxon’s current policy on climate change is “With increased global energy demand, energy-related carbon dioxide emissions are expected to rise by an average of 1 percent per year through the year 2030. As was recently summarized in the Fourth Assessment Report of the Intergovernmental Panel on Climate Change (IPCC), the risks to society and ecosystems from increasing greenhouse gas (GHG) emissions are significant. Meeting the enormous energy demand growth and managing the risk of GHG emissions are the twin challenges of our time.”
The most credible scientists and climatologists agree almost universally that global climate change (which is what it has always been called in the academic literature) is a major issue. Being a grad student and signing a petition does not make you a credible or respected scientist.
Also I did see that piece on the Australian ice study that has been reproduced ad infinitum in certain sections of the online media. Unfortunately if you bother to follow up by reading the source documents on the website of the Australian Antarctic Division you will find that they conclude that
“Ice loss has been greatest along coastal sectors of the Antarctic Peninsula and West Antarctica. However, ice thickening (gain) further inland and over most of East Antarctica may have partially offset this loss. All of the available estimates, however, show that the loss of mass in West Antarctica is greater than any added mass in East Antarctica.”
Can we vote CK off the island?
Jimbo,
I’ll concede that I did not “bother” to thoroughly read the Australian ice study. But my point is that the climate is ever evolving and we as humans tend to be very, very short-sighted. We focus on near term trends as opposed to the long term (not 100 yrs)trends.
More importantly, this has been politicized for gain. While I agree that we as a species must change our habits to sustain our environment, one must also recognize that the masses have been influenced by fear-mongering to achieve goals which I could not credibly argue I am aware of. Political gain would have to be high on the list, though.
Climate change will always exist. A clever person could use it to his own gain indefinitely.
Jimbo,
You appear to be well-informed. Perhaps you could enlighten me on why there was a global cooling and a global warming scare in our own lifetimes?
Jessica – Is that the island of naive sheeple buying into the BS of a political agenda? It’s hard to throw someone off an island they were never on dear.
Brian – All I did quickly was provide one link that discussed the topic. It happened to be from a conservative one. I guess that in your mind, the only possibly “factual information” could come from somewhere with a decidely liberal bent.
Oh CK, you are such a parody of yourself. And I’m not your “dear,” so please save that patronizing tone for you own particular brand of sheeple.
http://www.heartland.org/events/NewYork09/proceedings.html
CK: Really? The Heartland Institute is sponsoring a conference for climate change skeptics? Well, why didn’t you tell me? Climate change must be a scam!
The Heartland Institute also says there’s no problem with second-hand smoke, too: http://www.heartland.org/policybot/results/23399/Scientific_Evidence_Shows_Secondhand_Smoke_Is_No_Danger.html . That’s great too! Have the tobacco and oil companies also funded an institute that says I don’t have to pay my taxes? I’m looking forward to more good news from them!