
This month the Galveston Bay Foundation and Houston Advanced Research Center released their second annual report card on the health of Galveston Bay, boiling down a wide range of measurements into a series of letter grades. The report card, which looks at the bay itself along with the bayous that drain into it, aims to be easy to understand for folks with or without scientific training. Each of the 6 main categories of grade — including subjects like wildlife population trends, pollution sources, and human health hazards — is broken down with explanations of what specific measurements that rating is based on (and more details in the full report, for those who want them).
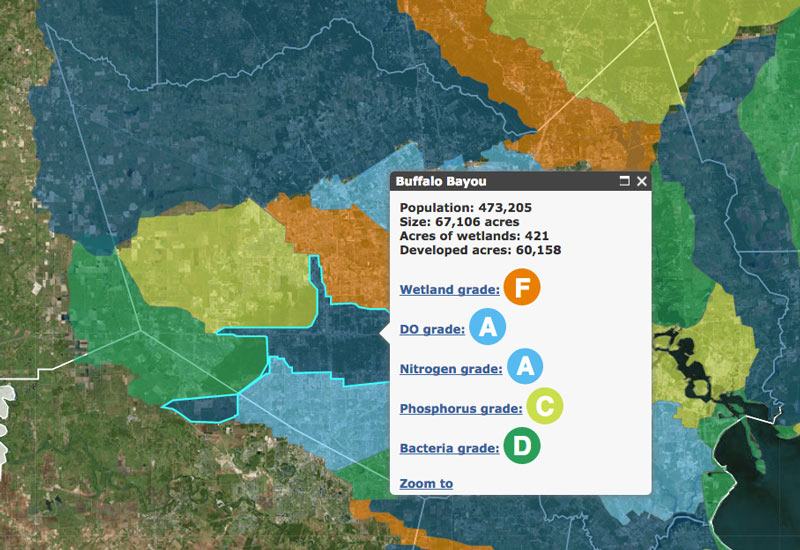
The agencies have also put together a Find Your Watershed tool, which lets you check in on how your own part of town is affecting the bay’s GPA. (That’s Buffalo Bayou watershed’s report shown above; the bayou did exceptionally well in dissolved oxygen and nitrogen content this term, but failed wetlands.) You can look up any address and see how the surrounding runoff area measures up in some of the report’s subject categories. (Note that the search tool’s map doesn’t use the same color-by-grade scheme that the rest of the report employs — you’ll have to click on each watershed to see the actual marks).
So how did the bay do this year?
***
This year’s release comes with a brief summary of the overall state of the bay: though the bay as a whole is still just pulling a C, some indicators of water quality overall have improved from B to A levels. The graders also added an invasive species grading category, and indicate other study areas (such as oyster reef trends) where the data isn’t complete enough to draw solid conclusions. Not happy with the marks? The report is also full of suggestions for specific things you can do to help boost next year’s score.
- 2016 Galveston Bay Report Card Interactive Site [GBF and HARC]
- Find Your Watershed Tool [GBF and HARC]
- Full 2016 Report Card [GBF and HARC]
Image: Find Your Watershed map
