DOCUMENTING HOUSTON’S TOWNHOUSIFICATION, ONE TWEET AT A TIME 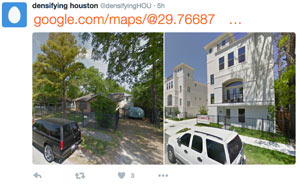 While you’re waiting for Kuukibot’s polite but insistent stream of air toxics tweets to come back, another Houston-obsessed account has just hit the Twittersphere — this one documenting the city’s infill development, as evidenced by daily before-and-after shots pulled from Google Streetview (like the 2-house-t0-7-townhome transition shown above, from near the intersection of Gibson and Snover streets in Brunner).  The account’s Philadelphia-based author (who’s looking for submissions, by the way) points to the 1999 changes in minimum lot size requirements as the catalyst for the subsequent waves of tightly-packed townhouse do-overs in previously large-lot neighborhoods around town, as explained by Daniel Hertz earlier this summer: Hertz writes that  the decision to allow lots as small as 1,400 sq.ft. within the Inner Loop (a decree later expanded city-wide in 2013) allowed the building of way more housing stock in the city’s core without a switch to multifamily-style buildings. “An important research project in the coming years ,” Hertz notes, “will be to see if Houston’s willingness to allow more housing—and especially missing middle housing—in the center of a growing metropolitan area can reduce the growth of housing prices and keep neighborhoods more diverse and affordable than they would otherwise be.” [City Observatory] Screenshot of Densifying Houston tweet: @densifyingHOU
Sign up for the Newsletter
Tag: Tools

This month the Galveston Bay Foundation and Houston Advanced Research Center released their second annual report card on the health of Galveston Bay, boiling down a wide range of measurements into a series of letter grades. The report card, which looks at the bay itself along with the bayous that drain into it, aims to be easy to understand for folks with or without scientific training. Each of the 6 main categories of grade — including subjects like wildlife population trends, pollution sources, and human health hazards — is broken down with explanations of what specific measurements that rating is based on (and more details in the full report, for those who want them).
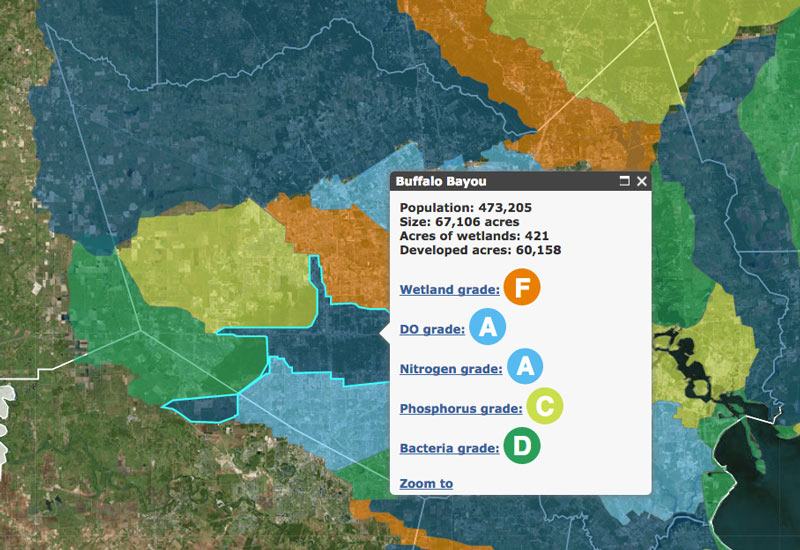
The agencies have also put together a Find Your Watershed tool, which lets you check in on how your own part of town is affecting the bay’s GPA. (That’s Buffalo Bayou watershed’s report shown above; the bayou did exceptionally well in dissolved oxygen and nitrogen content this term, but failed wetlands.) You can look up any address and see how the surrounding runoff area measures up in some of the report’s subject categories. (Note that the search tool’s map doesn’t use the same color-by-grade scheme that the rest of the report employs — you’ll have to click on each watershed to see the actual marks).
So how did the bay do this year?
Galveston Bay Schooling
