COMMENT OF THE DAY: HOUSTON’S POPULATION FORECAST DOESN’T ACCOUNT FOR THE WEATHER  “These studies always miss the boat on the climate change; I’d be surprised if population growth in Houston and the surrounding area hasn’t plateaued and maybe even begun to decrease by 2040. Let me put it this way: If even the most conservative projections are correct, I wouldn’t want to be living here then. If you think the flooding and the summer temperatures are bad now . . .” [Christian, commenting on Houston’s Population Will Break 10M by 2040, Says METRO Study] Illustration: Lulu
Tag: Population
HOUSTON-AREA POPULATION WILL BREAK 10M BY 2040, SAYS METRO STUDY 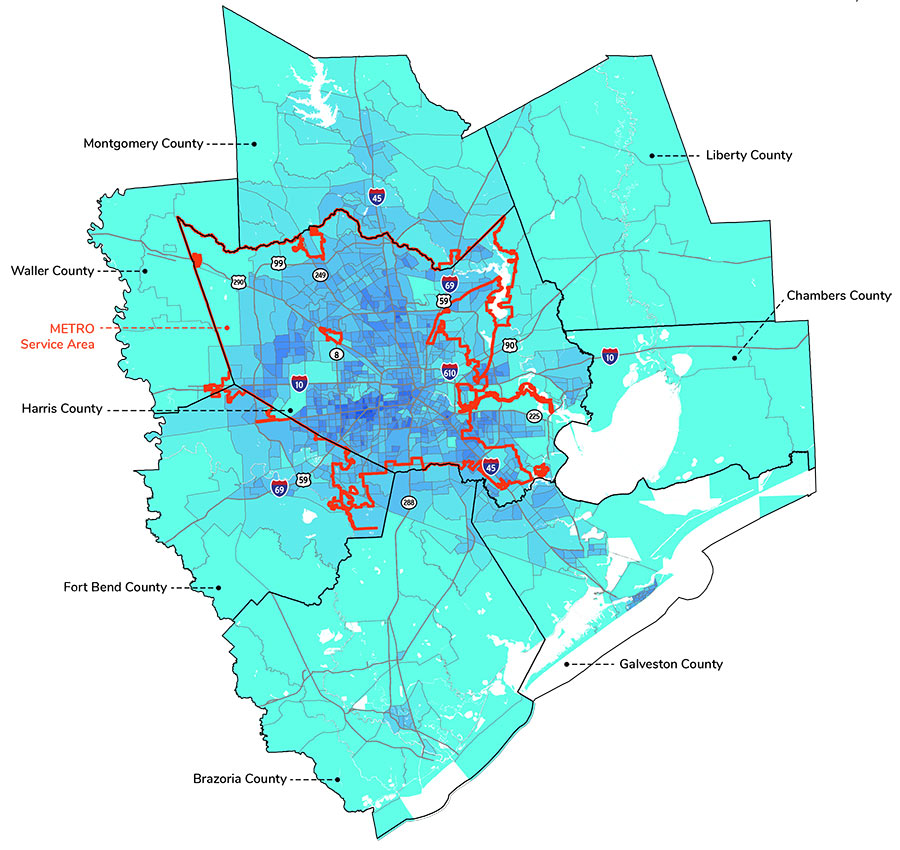 Making it more peopled than 40 different states are right now. Granted, the “Houston area” that METRO’s study encompasses — defined as Harris, Montgomery, Waller, Fort Bend, Brazoria, Galveston, Chambers, and Liberty counties — already spans more land than 4 states. The full breakdown on the transit agency’s website features more maps like the one above — on which more populous areas appear darker — showing 2025 estimates and historical data for years past. The area’s current population: somewhere around 6 million, according to census data. [METRONext] Map of Houston area’s estimated population distribution in 2040: METRONext
THE ASTONISHING RISE OF UNINCORPORATED HARRIS COUNTY 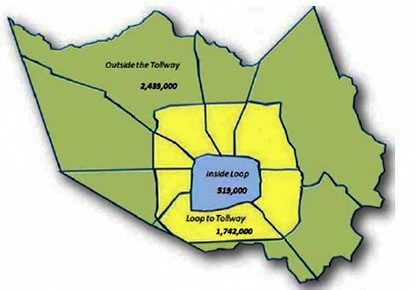 You already knew that more people in Harris County live outside Beltway 8 than inside it, right? And that of the people residing inside the Beltway, fewer than a quarter live inside the Loop? Here’s another nugget contained in the latest Harris County population report: the population of Harris County’s unincorporated areas will likely surpass that of Houston in 2020. That’s right: for 16 years, more than 80 percent of the growth in Harris County has taken place outside of the city limits of Houston and the 34 other cities that make up the county. Already, says the report, “‘Harris County Unincorporated’ would be the second largest city in Texas, the fifth largest in the U.S. and has a larger population than 14 U.S. states.” [Harris County Budget Management Department via Houston Chronicle] Map of populations inside and outside of ring roads: Harris County Population Report – January 2017
HOUSTON IS NO LONGER THE FASTEST GROWING CITY IN THE COUNTRY 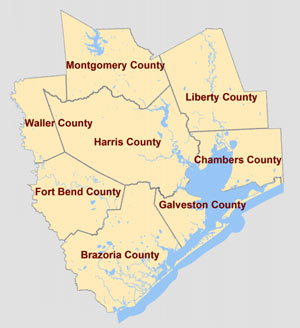 New Census Bureau numbers tracking population ins-and-outs between mid-2015 and mid-2016 have been released, Alexa Ura and Chris Essig note in the Texas Tribune this morning — and Houston is no longer in the number 1 spot nationally for growth among cities. Harris County as a whole, meanwhile, has also lost that top county population growth title (which it’s been defending for some 8 years) to Phoenix-containing Maricopa County in Arizona. The duo write that the growth that did occur in Houston itself was mainly from existing Houston residents having kids and from international immigrants moving in, while growth in Houston’s suburban orbit was more the product of migration in from elsewhere in the state and country; though the net population change was still positive, Harris County still lost around 44 people a day, probably in connection to the oil industry. [Texas Tribune] Map of Harris and surrounding counties: HGAC
HOW MANY DOWNTOWNS DOES HOUSTON HAVE? 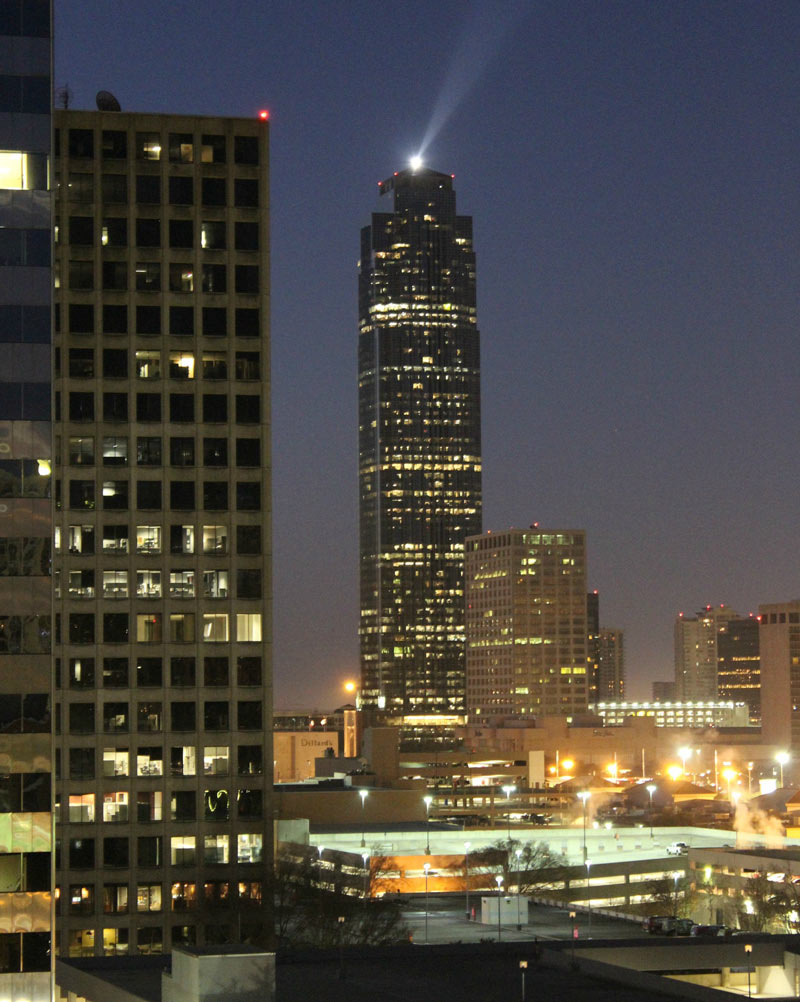 The list of Houston neighborhoods with potential to be mistaken for Downtown by outsiders, Blake Mathews of KHOU writes this week, is long, and includes at least “Uptown (Galleria), the Texas Medical Center, Greenspoint, Greenway Plaza, The Woodlands and perhaps even Westchase.” So what makes a Downtown? Mathews runs through some factors for consideration, ranging from the city’s population density center (which falls somewhere west of Downtown) to total office space (Uptown has less than downtown Houston, but more than downtown Denver) to building height (with a specific shoutout to the Williams Tower, pictured here.) [KHOU] Photo of Williams Tower: Russell Hancock via Swamplot Flickr Pool
COMMENT OF THE DAY: IT’S NOT THE SIZE OF INFRASTRUCTURE, IT’S HOW YOU USE IT  “This is less about the size and population of cities, and more about growth and how it’s handled. . . . Growth has terrible problems; rapid growth makes those problems worse, and poor planning makes them worse. But the alternative of urban decline is far worse than even rapid, poorly planned growth. It’s easy to complain about traffic and overcrowded schools, higher housing costs and overextended public services. But would you really rather live with a decaying, unused infrastructure that local government can’t afford to maintain, and schools that are shutting down and neglected? Would you rather watch as the tax base erodes and the City government goes defunct? Would you want to sell your house at a steep loss? Not me. Look at Chicago. Look at what Detroit went through. Sure, the traffic jams are a thing of the past, but at what cost? One other thing to note is that small cities and rural areas can struggle with growth, too. Look at what happened in Karnes County when the Eagle Ford Shale boom was going on. They had problems with traffic, dangerous roads, a lack of housing and skyrocketing prices, overcrowded schools . . .” [ZAW, commenting on Comment of the Day: Drawing a Line on Urban Expansion] Illustration: Lulu
WHICH CAME FIRST: THE TRAFFIC OR THE FREEWAY LANES? 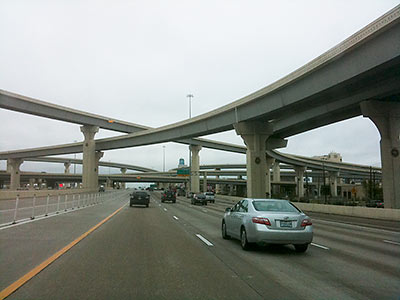 “Population growth doesn’t happen independently of transportation infrastructure—it’s profoundly shaped by it,” writes Daniel Hertz over at City Observatory this week. Hertz’s commentary comes in response to pushback following an article in which the blog weighed the outcome of the Katy Freeway’s 2008 expansion (calling out 30- and 55-percent increases in morning and afternoon commute times between 2011 and 2014). Pro-expansion readers purportedly commented that while travel times along the corridor did actually get worse, those same slowdowns would have been even stickier had the expansion not taken place when it did. But that’s backwards, argues Hertz, or at least a simplification: “In fact, research dating back at least to the 1950s has found over and over that highway construction in the urban periphery is associated with more housing construction there—and the depopulation o[f] urban neighborhoods. . . . Part of the way that highways fill themselves up with cars is by creating demand for housing near them.” [City Observatory, previously on Swamplot] Photo of I-10 West: Andres Lombana [license]
COMMENT OF THE DAY: SCOOTING ON OVER FOR THE FUTURE  “In 1860 the population density of NYC was 3,891 people per square mile. Houston today is 3,371. Were there a bunch of people in NYC around 1860 decrying the densification of NY to 11,381 by 1900? I’m not saying that Houston is like NYC but the world is only filling up with more people. In 1940 there were only a little over 2 billion people on the planet . . . today there are over 7 billion people. It is insane to think that the world, especially cities, are not going to change and become much much denser to accommodate this growth. What else are we going to do? Where are all these people going to live? The inner loop of Houston is where all of the action is at . . . demand is driving this. Some cities help mitigate a lot of the growing pains with comprehensive plans . . . I guess Houston has Swamplot and the invisible hand . . .” [Duston, commenting on Trio of Houses Across from Black Hole on Castle Ct. Is Coming Down] Illustration: Lulu
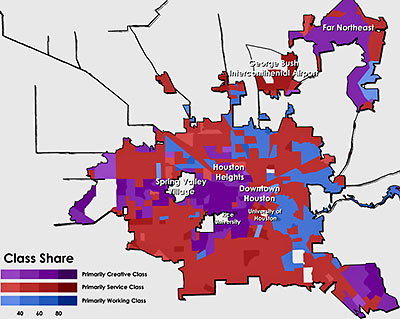
This map from Rise of the Creative Class author Richard Florida’s series at The Atlantic on “class-divided cities” shows where Houston’s working, service, and creative classes live.
Denoted here in purple, what Florida considers the creative class — that is, he writes, “people who work in science and technology, business and management, arts and culture, media and entertainment, and law and healthcare professions” — makes up 33 percent of Houston’s workers; that’s just a little bit larger than the national average, according to Florida, of 32.6 percent.
And what about the service and working classes?
HOUSTON’S HOLD ON NUMBER 4 2,257,926 people now live within the incorporated limits of the City of Houston, according to estimates released by the Census Bureau yesterday. The “incorporated limits” standard means Houston can still claim to be the nation’s fourth largest “city” (after New York, L.A., and Chicago) — even though Dallas and Philadelphia both boast larger regional populations. But the new numbers, which reflect a population increase of 14.4 percent from 2000 to 2009, are not 2010 Census population counts. They’re extrapolations from 10-year-old data, updated with adjustments from legal boundary changes, building permits, and county population estimates. Numbers from the 2010 Census won’t be widely available until April 2011. [U.S. Census Bureau]
YEAH, BUT HOW MANY ACRES DID THEY BRING? More than one million new residents moved to the Houston-Sugarland-Baytown Metropolitan Statistical Area between 2000 and 2008, according to a report released by the Census Bureau today. That puts the local area population at a little more than 5.7 million. “The Houston metropolitan area added more than 130,000 residents between July 1, 2007 and July 1, 2008, the second-highest number in the country after Dallas-Fort Worth, the bureau said. Among counties, Harris County added more than 72,000 people, trailing only Maricopa County, Ariz., in growth in sheer numbers.” [Houston Chronicle]

