PEARLAND, CITY OF 3 WALMARTS  Ahead of this weekend’s local runoff election, the Christian Science Monitor delves into the rapid growth and demographic shifts in the “dumbbell-shaped suburb” of Pearland — and how a few candidates for municipal office are approaching it: “Its diversification is largely a result of [Houston’s] inexorable sprawl . . . where residents keep moving farther out in search of lower-density living.” Pearland now ranks as the nation’s eighth-fastest-growing city, but Houston’s only second-most-diverse suburb, where, writes Simon Montlake, as many as 75 languages are spoken in local schools, but residents refer to the eastern-most Walmart in town as the “white Wal-mart†— “because of who shops there – and who doesn’t.” At a forum held in the Bella Vita Club at the center of the age-restricted Bellavita at Green Tee community off Scarsdale Blvd. just east of the Golfcrest Country Club, a middle-aged woman wants to know how candidates plan to draw together what she sees as the “two cities” of Pearland. “Pearland is solidly middle-class,” Montlake notes. “A starter house costs $140,000, and median household income is $97,000, much higher than in Houston. But newcomers rushing to downtown jobs barely brush shoulders with the mostly white retirees who tee off on the golf course weekday mornings or the older families that work and play near home.” [Christian Science Monitor] Photo of Bella Vita Club: 55places.com
Tag: Demographics
COMMENT OF THE DAY: THE 2 TYPES OF WILLING LONG-TERM HOUSTONIANS 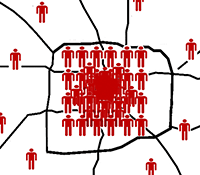 “This data doesn’t surprise me at all — not because Houston has high quality of life (as a lifelong resident, we don’t), but rather because of the demographics who live here. I’d bet that a sizable majority of Houston residents fall into 1 of 2 categories: Older, settled people who have already made their choice and are unwilling to change, OR transplants from vastly more difficult situations in places like Central America, Vietnam, or the economically depressed parts of the Midwest. Houston looks pretty good when you compare it to third world type (or barely better than) living conditions — not so good when you compare it to more desirable U.S. cities. I’d be willing to bet that these numbers would change substantially if you narrowed the criteria to the “young, educated professionals†which every city wants to add to their workforce and tax base. These people demonstrably prefer to live in places like Austin, Denver, Portland, or Seattle, or (if they can afford it) Boston, NYC, San Francisco, or D.C.” [Christian, commenting on Houstonians Do Actually Want To Live Here; Freedmen’s Town Brick Fix Goes Wrong] Illustration: Lulu
HOUSTON IS NO LONGER THE FASTEST GROWING CITY IN THE COUNTRY 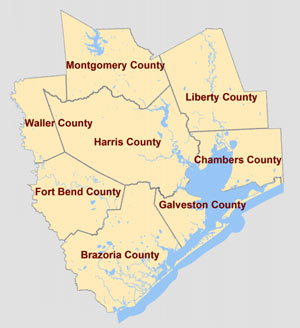 New Census Bureau numbers tracking population ins-and-outs between mid-2015 and mid-2016 have been released, Alexa Ura and Chris Essig note in the Texas Tribune this morning — and Houston is no longer in the number 1 spot nationally for growth among cities. Harris County as a whole, meanwhile, has also lost that top county population growth title (which it’s been defending for some 8 years) to Phoenix-containing Maricopa County in Arizona. The duo write that the growth that did occur in Houston itself was mainly from existing Houston residents having kids and from international immigrants moving in, while growth in Houston’s suburban orbit was more the product of migration in from elsewhere in the state and country; though the net population change was still positive, Harris County still lost around 44 people a day, probably in connection to the oil industry. [Texas Tribune] Map of Harris and surrounding counties: HGAC
COMMENT OF THE DAY: ACTS OF PREEMPTIVE CALIFORNIA-IZATION IN THE HOUSTON SUBURBS 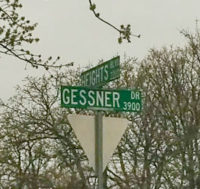 “Someone ought to do a subdivision in Katy/Fulshear and name the streets Crenshaw, Imperial, Valley View, etc. Would (i) be humorous and (ii) help keep the California transplants outside Beltway 8. Win-win.” [Purple City, commenting on The Denton Suburban Roadways Quietly Impersonating West Houston’s Iconic Streets] Photo of Houston street names in Denton, TX: Lauren Meyers
HOW MANY DOWNTOWNS DOES HOUSTON HAVE? 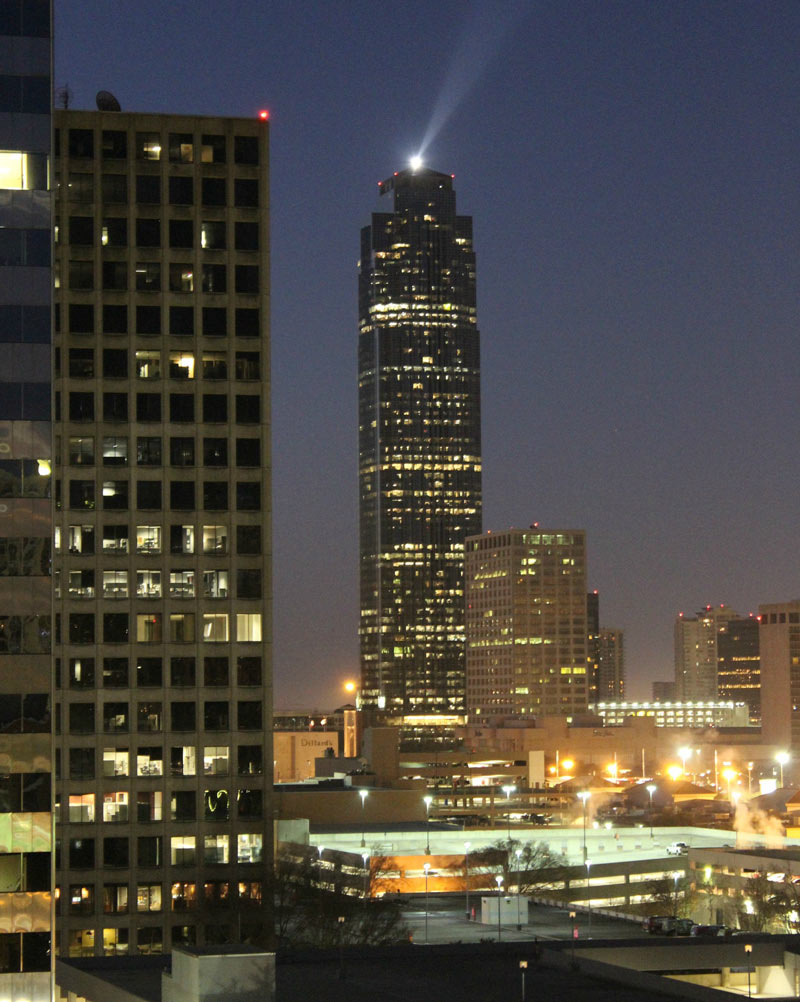 The list of Houston neighborhoods with potential to be mistaken for Downtown by outsiders, Blake Mathews of KHOU writes this week, is long, and includes at least “Uptown (Galleria), the Texas Medical Center, Greenspoint, Greenway Plaza, The Woodlands and perhaps even Westchase.” So what makes a Downtown? Mathews runs through some factors for consideration, ranging from the city’s population density center (which falls somewhere west of Downtown) to total office space (Uptown has less than downtown Houston, but more than downtown Denver) to building height (with a specific shoutout to the Williams Tower, pictured here.) [KHOU] Photo of Williams Tower: Russell Hancock via Swamplot Flickr Pool
The larger the dot in the interactive map above, the more frequently the surrounding ZIP code deals with sewage overflows, per to the city’s tally of sewage spills between 2009 and 2014. The map, put together by Rachael Gleason with data prepped by John Harden and Mike Morris, goes along with Morris’s update in the Chronicle this weekend on the city of Houston’s ongoing negotiations with the EPA over what to do about the city’s sewage-related water quality issues, with the estimated cost of required infrastructure upgrades and education programs on the horizon currently hanging out in the neighborhood of $5 billion dollars.
The Chronicle’s analysis also notes that most of the areas with above-average sewage spill rates are home to above-average poverty rates, as well as above-average proportions of black and Hispanic residents than the city as a whole. The map above allows readers to superimpose the spill numbers over each ZIP code’s median income and poverty rate (you’ll have to look elsewhere for maps backing up the other claim, though). Another map released earlier this summer pinpoints more precisely the spots where the sewage flows most freely — areas in purple below have seen a minimum of 45 documented sewage spills in the 5-year data period:
WHO SETS THE AGENDA ON HOUSTON TRANSPORTATION? 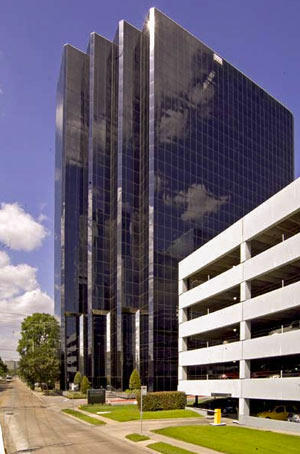 “Who decides Texans will depend on cars?” asks freshly-former Houston Tomorrow director Jay Crossley this week. Crossley notes that several of the Houston-Galveston Area Council’s meetings in the last few months, which collectively mulled over how to use more than $48 billion for transportation projects in the country’s most racially diverse city, were — as is the norm — “overwhelmingly dominated” by white men. “Why does this matter?” Crossley asks, before answering himself: “In the Houston region, there are still some places where non-Hispanic white people are the majority (at 55 percent) — and that’s everywhere that is more than ten miles from a major job center. It should come as no surprise that those low-density, car-dependent areas claim far more than their share of the region’s transportation projects, and that those projects are disproportionately tilted toward people in cars.” Crossley also notes that while long-term plans for the region call for more mass transit, most of the projects actually getting funding in the short term are still going toward car infrastructure. To change things up, Crossley calls for state and local transportation decisionmaking groups to be more open to “women, people of color, and people whose livelihoods don’t involve real estate or cars.” [Houston Chronicle] Photo of office building at 3555 Timmons Ln., where HGAC monthly public meetings are held: Unilev
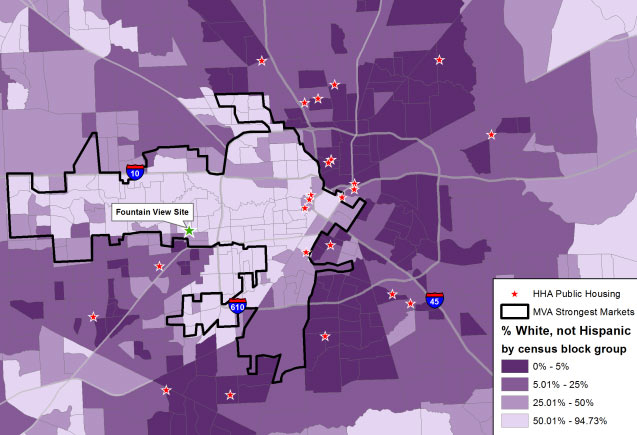
The pale arrow pointing from W. Beltway 8 to Downtown in the map of Houston above is made up of census blocks recorded as more than 50 percent white, according to a post by Will Livesley-O’Neill for Texas Housers yesterday. The Austin-based nonprofit, which researches low-income housing policy around the state, published yesterday’s article as a followup to some previous posts about the mixed-income housing complex that HHA is planning for the site of its own office building on Fountain View Dr. in Briargrove. The demographic breakdown on the other 3 shades shown on the map, from lightest to darkest: 50 to 25.01 percent white, 25 to 5.01 percent, and 5 to 0 percent.
The map also marks the locations of existing Houston Housing Authority public housing developments as red stars, mostly outside of or skirting the majority-white census blocks; the proposed Fountain View housing site is singled out, tagged, and marked with a green star. Meanwhile, the black outline looping mostly around the majority-white areas is lassoing the market areas deemed strongest by the Reinvestment Fund‘s Market Value Analysis for the city.
- Video: Anger over proposed public housing in high opportunity Houston neighborhood [Texas Housers]
- Previously on Swamplot: The Mixed-Income Housing Project That Would Replace Houston Housing Authority’s Own Office Building in Briargrove
Map: Texas Housers

