PRICE DROPS ARE UP! Been noticing more local home sellers slashing prices? It’s not just that HAR listings now highlight them: Real estate website Trulia notes that one-quarter of all homes it tracks in the Houston market (mostly through MLS) dropped their asking prices over the last year. That’s 32 percent more price cuts than for the previous year-long period, and qualifies Houston as one of the top 5 cities Trulia follows where asking-price reductions have been on the upswing. The average price cut here: 9 percent. [Trulia, via Houston Business Journal]
Tag: Price Trends
COMMENT OF THE DAY: PUMPING THE HEIGHTS “I grew up in West University in the 1980s and watched it change from a shabby lower middle class neighborhood to what it is today. I now live in the Heights, and the area is remarkably similar to the way West University was during my childhood. The similarities include everything from housing stock, neighborhood amenities, and eclectic mixture of residents. The location is also similar to West University, in that it is convenient to all of Houston’s major destinations. Mr Kelley’s prediction that the Heights will follow the same upward trend as West University is probably correct, and I think investing in the Heights is a wise move. As the Heights continues to improve, the demand to live in the area will continue to increase and real estate prices will reflect that. If I had more cash right now, I’d buy another house in the area and hold on to it.” [Obsolete, commenting on Comment of the Day: Priced Out of the Conversation]
COMMENT OF THE DAY: PRICED OUT OF THE CONVERSATION “The fact that ‘many’ people think the Heights is overpriced is meaningless – if other people besides yourself think that home prices in the Heights are spot on and actually buy the homes, it doesn’t matter what everyone else thinks. For the record, the way you feel about the Heights is how I feel about West U. I think the neighborhood is completely overpriced and I would never pay the going rate for West U. But – clearly, many people disagree with me, as those houses continue to fetch what I consider to be ridiculous prices. I can argue as long as I want that West U is overpriced and I can take my money elsewhere, but all that means is that I’m clearly out of step with hundreds of people who feel differently.” [LT, commenting on Swamplot Price Adjuster: The Heights of 2-2ness]
COMMERCIAL BREAK The dollar volume of Houston-area commercial property sales for the 12 months through March was $2.36 billion, almost exactly half the figure for the previous 12-month period, reports LoopNet: “In the Houston office market, only $830 million worth of deals closed in the period ending in March 2010 compared to $1.37 billion a year earlier, while the price per square foot dropped to an average of $110 compared to $172 a year earlier. The square footage price in the Houston retail market has dropped the most precipitously, down to $69 in the most recent period from $143 a square foot for the year ending March 2009.” [Houston Business Journal]
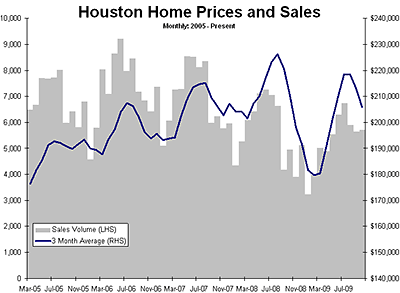
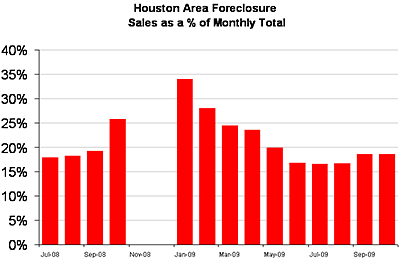
Swamplot’s chart-wielding analyst is back with a few comments on the Houston Association of Realtors’ latest report and media push:
Median and average home sales prices fell $7,200 from the prior month. This was including increased activity to get the $8,000 home buyer tax credit in under the wire! Now it is not fair to compare month to month numbers as seasonal factors are working against the housing market this month.
So we get some good spin from the realtors: “Home prices up 5%†“Sales up 13.8%†…this maps directly over to the mainstream press with no research: “Home sales rise for second month,†“Home prices up 5%,†“Sales up 13.8%†Homeowners in this town should be proud that such a hardworking PR machine still gins out great product!
Why would you call those year-over-year increases spin?
The realtors get to make a press release every month and every month something is a “record†and the press is under deadlines and it gets copied in verbatim. This is home prices up 5% and sales up 13.8% from HURRICANE IKE with no caveat in the headline going out to 200,000 print readers and as many web readers! Not bad for a days work.
Oh, yeah. Forgot about that whole Ike thing. So what’s the market looking like really?
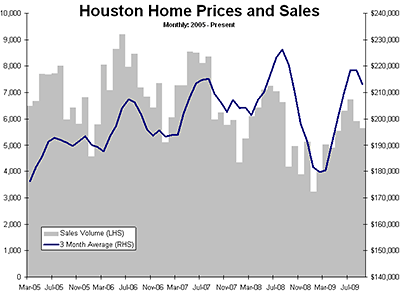
HAR is out with its September home-sales figures, giving Swamplot’s spreadsheet-side correspondent a chance to eulogize the spring-summer selling season:
Home prices and volumes are flying south for the winter. With this volume downturn for the year, we have most likely seen the highs and sales volumes will now complete their third year of contraction. Prices were down 2-3% in the month, depending on whether you follow the median price or the average price. Pending sales are well below sales for the month, suggesting a further seasonal contraction in October.
This month featured an upturn in foreclosure sales as a percentage of the total. Foreclosure sales were 18.6% up from 16.7% the prior month. Luckily, foreclosure sales are still way down from the 32% peak in January.
But aren’t all those foreclosures going away soon?
COMMENT OF THE DAY: THE AGE OF APPRECIATION “[In] my humble observances, I have noticed that the new construction only maintains plateau value or loses it while the older homes in the area gain. Sure, many homes may be sold for lot value, but if you buy a 60 year old home vs a 5-10 year old home, the difference is relative. (See low-end River Oaks, West U, Bellaire, Heights, Braeswood, etc). In the Heights, the kept-up bungalows outpace the new-builds (on a square-footage basis) by far. They also sell in a few days (with many offers) vs months.” [justguessin, commenting on Swamplot Price Adjuster: $2 Million Plus In Town]
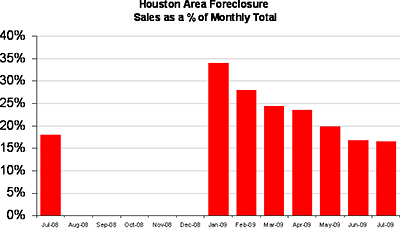
HAR’s real estate sales report for July is out! And Swamplot’s housing-market reader-analyst uses the data to piece together a better picture of Houston’s still-somewhat-mysterious foreclosure scene:
The press releases in 2009 have included a running commentary on the % of foreclosure sales in the month. This month’s release featured an interesting nugget — foreclosure sales from the prior year’s month! It is new information, and a few future monthly releases of it will allow us to fill in the data gap in the graph [above].
The foreclosure graph can be looked at in two ways. The glass half full crowd can cite the fact that a wave of foreclosures has been passed through the system — like a painful kidney stone — and it hasn’t led to piles and piles of unsold homes on top of each other in a negative feedback loop. Inventory is down to 6.5 months, backing this view.
And what if you aren’t sure there’s enough water in that glass to, uh . . . pass those stones?
HOUSTON-AREA MORTGAGE STORM SURGE: NOW A QUARTER UNDER WATER Another few months, another one of those studies from research firm First American CoreLogic — this one using data from the end of June. By that date, the firm says, 26.15 percent of all Houston-Sugar Land- Baytown-area mortgages were in a “negative equity” position. Add in the “up to their eyeballs” crowd of mortgage-holders who are within 5 percentage points of owing more than their homes are worth, and the figure rises to 33.86 percent. That’s a marked increase from the figures in the firm’s March study, which used data from September 2008. [First American CoreLogic; previously on Swamplot]
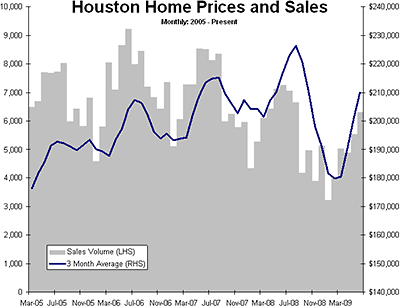
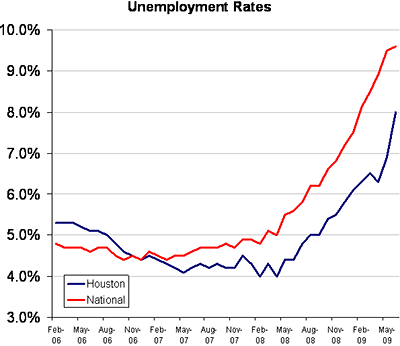
“The increase in local unemployment reported this week is sickening,” reports Swamplot’s local financial correspondent. But don’t the latest HAR numbers show Houston home prices at some sort of record high?
Historically, the peak for home prices comes in July or August every year. The increase in the median and average over the past several months has been due to two factors. First, seasonality –summer prices are always the highest. Second, a change in the “product mix†of Houston homes –the % of foreclosed homes has fallen every month for several months straight . . . So the change in the product mix means that the value of any given house probably has not risen, only a change in the product moving through the system is reflected in the numbers.
Is it okay to get excited about the foreclosures, then?
THE SECRET SALES PRICE SECRET Over the past 2 years, the practice of omitting sales price information from Multiple Listing Service sales forms has increased, possibly skewing reported median home price data, reports Steve Brown in the Dallas Morning News. In several high-end Dallas neighborhoods, transactions with a “Z” in the price column now account for the majority of sales: “Because of the way the MLS database is structured, it’s hard to find out how prevalent the practice is. . . . Jim Gaines, an economist with Texas A&M University’s Real Estate Center, wonders how withheld prices affect the data his center releases to the public each month. ‘Of course, if these are systematically at lower prices, then our averages and medians are overstated to the extent they are not showing lower-priced property sales,’ Gaines said.” Texas is one of only 5 states that doesn’t require public disclosure of home sales prices. [Dallas Morning News]
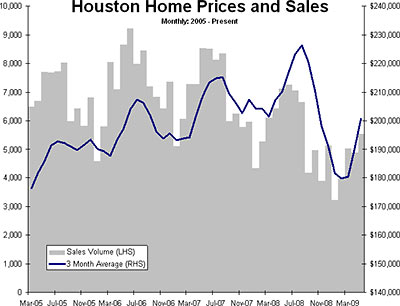
The May home numbers are in and they’re . . . not so bad, says Swamplot’s chart-wielding commentator:
The “spring selling season†is going well as average home prices are up 21.6% since the beginning of the year. Errrr…ummm….that is a big move and it underscores that there is a strong seasonal trend at work. The big bounce brought us up to slightly above May of last year on a median basis. Positives included record low interest rates and foreclosures were “only†20% of the total.
Fewer foreclosures is better, right?
A reduction in foreclosure sales is a change in “product mix†and doesn’t reflect on the price of a given home. In prior reports we were encouraged to ignore them, now the lower # of foreclosures is embraced and is cited as “price gains.†The strong seasonal trend is powerful enough to keep the housing “bears†like me silent for a few months. May also featured some of the lowest interest rates in a long time, so buyers were poised to move and lock in lower rates.
COMMENT OF THE DAY: INNER LOOP RENTS, HARD AND HIGH “I have to disagree with rents being soft in the inner loop. I just relocated here in January and, unless things have changed, I found rents exceedingly high and availability low. Granted, I did not want a cookie cutter apartment, but I was blown away by the prices. I looked at the new Gables property on Kirby and they were $2,500 minimum a month for a two bedroom. The kicker was that they’d only accept a 18 month lease. I thought that was crazy. The Alexean on Westheimer was a little cheaper at $2,000 per month but it didn’t seem well built. I preferred condo’s or houses to apartment complexes and most of them were in the $2,000 plus range. Those under $2,000 that were nice rented almost immediately after coming on the market. I wound up in a two bedroom house in Montrose for $2,600 and everyone I talk to seems to think I got an ok deal. I have to concur that it seems more expensive to rent than buy. I certainly could have bought for less in this market but, being new to town, didn’t want to dive in to home ownership immediately. Anyone that says Houston is cheap hasn’t looked at inner loop real estate.” [Charlie, commenting on Where Rents Have Dropped]
COMMENT OF THE DAY: THE UPPER LIMITS OF INNER LOOP RENTS “The reason the inner loop is ‘soft’ is simple math. A tiny apartment is now something like $1,200 per month. Meanwhile, my mortgage on my inner-loop house is just over $1,300.” [me, commenting on Where Rents Have Dropped]
WHERE RENTS HAVE DROPPED The latest stats provided to 11 News by Houston-based Apartment Data Services show that at the newest complexes, rents for all size of apartments are now averaging $1,108. That’s 11 percent cheaper than last year. Rents are about the same for complexes built a decade ago, averaging $739 a month. And rents are actually up slightly at older complexes, where they’re averaging $570 a month. ‘I’d say the inner loop is probably the softest,’ said Bruce McClenny of Apartment Data Services. ‘They’re about 40 percent occupied,’ McClenny said of brand-new complexes that traditionally take a year or two to fill up. . . . We’re told rents are holding steady for many apartments in far west Houston, Katy, The Woodlands, Kingwood, and Sugar Land. Demand remains strong in those places. Why? The energy industry, for one. ‘The energy corridor’s taking off again in west Houston. There’s lot of growth, people relocating day in day out,’ according to Shannon Proteau, another agent with Find It Apartment Locators. But, in a twist, Proteau said it’s also because families forced out of homes by foreclosure are attracted by highly-rated suburban school districts.” [11 News]

