WHERE HOUSTONIANS HIDE FROM TOURISTS Writing in the travel section of the St. Louis Post-Dispatch, devoted Cardinal fan and reporter Diane Toroian Keaggy blows the lid off the great Houston population hoax: “Who am I to argue with the U.S. Census, Greater Houston Convention and Visitors Bureau and Post-Dispatch pal and Houston native Aisha Sultan? But no way is Houston the nation’s fourth largest city. Where are the people? Certainly not downtown, which cleared out immediately after the Astros win. The Museum District, easily reachable from downtown by rail and home to the Houston Zoo, Children’s Museum and Museum of Natural Science, also seemed strangely quiet. We wanted to visit the Contemporary Art Museum, the Byzantine Fresco Chapel, the Menil Collection, the Houston Center of Photography and the wacky folk-art mecca called the Orange Show. Each was closed on Tuesday. We could have visited the Space Center Houston, which includes the tram tour of NASA’s Johnson Space Center, but it’s 25 miles south of downtown and costs $21. That’s too much money and time for a short two-day trip. Instead we visited the Museum of Fine Arts, which features an impressive collection of Impressionism and the Weather Museum, which feels more like a seventh-grade science project than an actual attraction. Don’t bother. . . . We continued our search for life at the Galleria, one of the nation’s top malls. A-ha! So that’s where everyone was hiding. Home to Fendi, Dior, Chanel, Yves Saint Laurent, Versace, Tory Burch and other impossibly expensive boutiques not found in St. Louis, the Galleria boasts 375 shops spread across two large buildings. Bring comfy, but fashionable, shoes. The mall claims to attract 24 million shoppers each year, and only a few seemed to be buying Gucci glasses, Kate Spade earrings and Jimmy Choo pumps. The rest could be found skating on the indoor ice rink or slumming it in Banana Republic, Apple and Claire’s.” [STLToday]
Tag: Houston Data
Where are all the demolitions scheduled to take place Saturday, in Houston’s annual mass celebration of destruction? Reader Ed from Westbury has put together a handy-dandy map using BatchGeo that shows the locations of the buildings targeted by the city’s Neighborhood Protection department that have received demolition permits since last Friday. There should be more than 400 in there. Is your favorite condemned building missing from the map? Ed promises to update it over the weekend with any permits taken out today. Click here to see a larger version.
- Houston Dangerous Building Demolitions 2011 [BatchGeo]
- Owners prey on poor with dangerous rentals [Houston Chronicle]
Map: Ed from Westbury
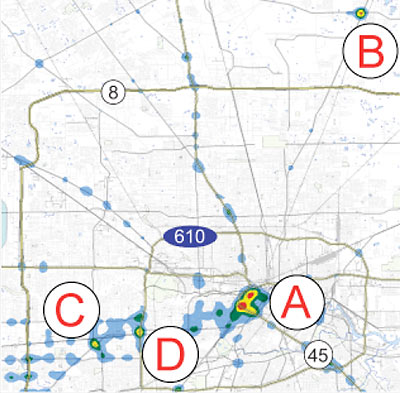
 Texas Watchdog crunched 2009 car-crash data from TXDOT to find the parts of town where wrecks were concentrated. The heatmap above resulted from plotting location information from almost 100,000 Harris County incidents, most of which included exact coordinates. The winners? Two separate sections of Downtown and the intersection of FM 1960 and Hwy. 59 north, near Deerbrook Mall. (One of those Downtown hotspots, centered on Metro’s Main St. headquarters, includes the Pierce Elevated.) Also noteworthy spots for wreckage buffs: 2 sections of the Southwest Freeway — one at the West Loop and the other at Hillcroft.
Downtown also topped Texas Watchdog’s separate breakdowns for accidents involving road rage and collisions involving cellphones. But second- and third-place winners in these categories produced more local champions: Westheimer at Hillcroft, the Galleria area, and 59 at Kirby all ranked highly as sites for road-rage incidents. For cellphone-related accidents, the top areas were Montrose, an area just south of the Galleria and southwest of the 610-59 interchange; and the route from the Johnson Space Center to I-45. The northeastern corner of the 610 Loop at Liberty Rd. won the fatality division outright.
Map showing wreck concentrations: Jennifer Peebles/Texas Watchdog
HOUSTON BITES THE MOST Dogs bit mail carriers more times in Houston last year than in any other U.S. city, the U.S. Postal Service announced yesterday — in advance of National Dog Bite Prevention Week. 62 dogs got a taste of a Houston postal employee in 2010; San Diego and Columbus, Ohio, ranked second, with only 45 incidents each. The nationwide tally: 5,669 canine attacks on mail carriers in more than 1,400 cities, costing the agency nearly $1.2 million in medical expenses. [USPS]
OAK FOREST: NEW WEST U OR MINI BELLAIRE? The Chronicle is out with its annual survey of area home prices. Sadly, this year’s online version doesn’t allow easy cost-per-square-foot comparisons, leaving Houstonians who like to build and buy their residences in bulk without much to oooh and aah over. Consolation: The accompanying neighborhood profiles include a peek at the controversy that’s apparently been raging through Oak Forest: “‘I call it the new West University,’ said Jason Light, owner of the Light Group, a local real estate firm active in the Inner Loop area. . . . Marlene Casares and her husband, Jalin Casares, looked all over town before settling on Oak Forest, she said. A year ago they bought a new 4,300-square-foot home. . . . ‘It’s like a little mini Bellaire, but with better prices,’ she said.” [Houston Chronicle]
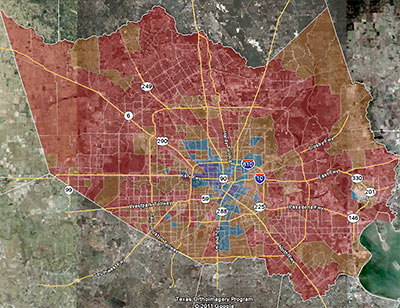
One of the big local stories of the 2010 Census was the decline in the number of majority-Anglo areas throughout Harris County. This map from consultant and Census obsessive Greg Wythe diagrams the trend pretty clearly. The areas colored red are where the portion of the local population identifying itself as Anglo dropped 10 percent or more; the areas where that group’s share of the population dropped by less than 10 percent are marked brown (Wythe says he started out painting them orange, but the satellite photo in the background made it darker). Areas marked a light blue are where the percentage of Anglos increased by less than 10 percent. And the dark blue (okay, purplish) areas show where Whites have been rushing in: Anglos’ share of the total population jumped by more than 10 percent in those areas.
“If you were to measure solely on the basis of the number of Anglos,” he explains, “you’re likely to see a lot of growth in areas where there’s growth in general. Cypress is an example — they grew in every demographic because they grew a lot, period.” But Wythe’s map tracks the changes in percentage of the population, not population growth.
The big exception to the overall trend of declining percentages of Anglos? The Heights.
COMMENT OF THE DAY: THE SLICE OF HOUSTON WHERE NOBODY’S HOME “I did NRFU (Non Response Followup) surveys for the census in the wedge between 45 and the Ship Channel and this doesn’t suprise me at all. LOTS of people don’t answer the door. Lots more told me of one, two, or three residents when in fact an evening visit’s observations yielded six or eight.” [Some d00d, commenting on Houston to Census Bureau: Count Again]
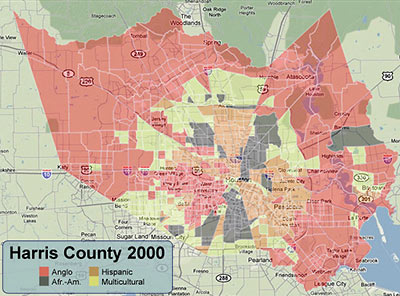

Sprinkling a little color on census tracts that came up majority Anglo, majority Hispanic, majority African-American, and those where no group is in the majority, blogger and consultant Greg Wythe finds that last category has grown considerably in Harris County over the last 10 years. A good chunk of what was a solid-red block around Cypress and northwest Houston, for example, has gone multicultural yellow in the 2010 map. Wythe says the 2010 Census didn’t identify any majority-Asian census tracts — though 3 of them came up in the 40-to-45-percent range. He also put together these interactive versions of the same maps, so you can zoom in and around your own favorite spots:
Elected officials will have to wait until June to file formal challenges to Houston’s omigosh-where’d-everybody-go? low population count in the 2010 Census, but the grousing has already begun. Houston’s population came in just a Florida recount under 2.1 million; that’s about 160K fewer people than the Census Bureau’s own American Community Survey figured were camping out within city limits the previous year.
Census maps show a huge section of east Houston — most of the area inside Loop 610, east of Interstate 45 – lost population, as did sections of southwest and northeast Houston.
Those areas are predominantly Latino and African-American, populations that historically are most likely to be missed by the census. . . .
[State Rep. Ana] Hernandez Luna said some people, especially immigrants who are here illegally, may have been reluctant to participate, despite assurances that the information would not be shared with immigration agents.
“We’re all a bit skeptical when we’re giving so much detailed information about our household,” she said. “For those that are undocumented, they want the least amount of contact they can have with the government.”
Meanwhile, an analysis of the Census data prepared by Houston’s planning dept. shows that census workers counted 71.7 percent more vacant housing units in the city in 2010 than they did in 2000.
- City to challenge census count [Houston Chronicle]
- Basic Census Data Comparison: 2000 & 2010 (PDF) [Planning Dept.]
- Previously on Swamplot: New 2010 Census Numbers Document Houston’s Trickle-In Decade
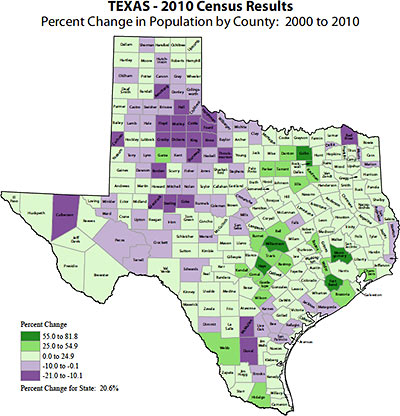
Houston’s population grew by just 145,820 over the last 10 years and now stands at 2,099,451, according to the U.S. Census Bureau, which released some Texas data from the 2010 Census today. The City of Houston’s 7.5 percent population growth rate was lower than the double-digit rates achieved by San Antonio, Austin, and Fort Worth, but still ranks ahead of the city of Dallas, whose numbers barely budged. (From 1990 to 2000, Houston’s population increased by 19.7 percent.) It’s a slightly different story for the surrounding areas: Harris County is still the most populous county in the state by far, growing 20.3 percent since the last census, to 4,092,459. But nearby Fort Bend, Montgomery, Waller, Brazoria, and Chambers counties all grew faster. Fort Bend County’s 65.1 percent growth rate over the last 10 years ranks it as the second-fastest-growing of the largest 20 counties in the state (Williamson County, north of Austin, is filling up faster by only a few percentage points.)
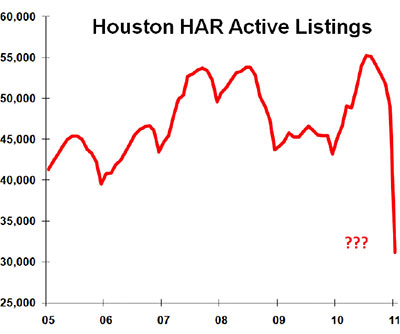
One of the more surprising stats in the latest residential home-sales data released yesterday by the Houston Association of Realtors, Swamplot’s numbers expert is kind enough to point out, is a whopping almost 40 percent drop in the number of listings that were active last January. Whazzat mean? That there were 40 percent fewer active listings this January than in January 2010? No, it’s screwier than that: The latest HAR report says that there were almost 40 percent fewer active listings in January 2010 than their own reports told us a year ago. Revising last year’s numbers down so dramatically, of course, makes it a whole lot easier for the local real-estate organization to announce at least one piece of news in this month’s press release: Listings are up 13.7 percent over this time last year!
But the new report doesn’t mention any adjustments. And it makes similar — though less dramatic — changes to last year’s data in several other categories.
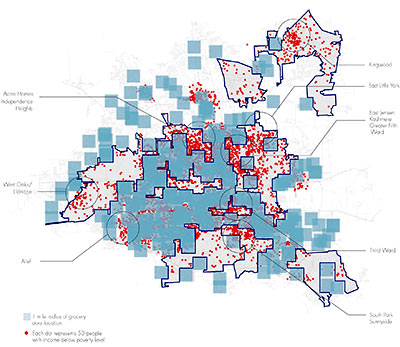
A graphic produced by UH’s Community Design Resource Center late last year maps Houston’s “food deserts” — sections of town that are more than a mile from the nearest grocery store and where a high proportion of residents live below the federal poverty line. The group found grocery-poor areas in parts of the Third Ward, Alief, Sunnyside, South Park, Acres Homes, Independence Heights, East Jensen, Kashmere, the Fifth Ward, East Little York and West Oaks. In all, the group counts more than 250,000 low-income Houstonians living more than a mile from a grocery store; according to their calculations, more than a quarter of that number have no access to a vehicle. A larger version of the group’s preliminary map, where blue squares represent grocery stores and each red dot stands for 50 people with income below the poverty level, is here.
- Houston: Desertia [Super Houston]
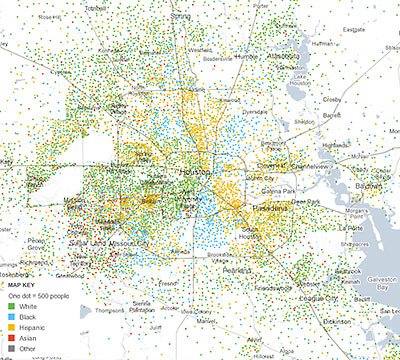
Remember those cool dot-by-dot renderings detailing the racial and ethnic distributions of 100 or so cities Swamplot featured a few months ago? Eric Fischer’s eye-opening map of Houston showed a city striped with different-colored pie-shaped wedges, but didn’t have much you could dig into. Working with data company Social Explorer, the New York Times website now has a version that displays much the same information, but it’s interactive, and allows you to zoom in on individual Census tracts. The “Mapping America” project covers the entire country and allows exploration of other metrics related to ethnicity, housing and families, income and education. Nothing’s included from the 2010 Census yet, though: the data comes the Census Bureau’s annual American Community Survey through 2009.
A few notable Houston-area snapshots include this map to same-sex couples:
A few tidbits on the Houston-Sugar Land-Baytown area from data released yesterday by the American Community Survey. The ACS is an annual survey conducted by the U.S. Census Bureau that’s separate from — and much more detailed than — the 2010 Census. (It replaces what used to be the Census’s “long form”.)
- Total area population: 5,865,086
- Percentage of population Between 5 and 17 years old: 20.1 (that’s the largest segment)
- Percentage of households that are “nonfamily households” (includes same-sex-couple households with no relatives of the householder present): 28.9
- Average number of people per household: 2.89
- Percentage of people over 15 years of age who are currently married (and not separated): 50.1
- Percentage of population over 25 years of age with a bachelor’s, graduate, or professional degree: 27.9
- Percentage of adult population who are civilian veterans: 7.4
- Percentage of noninstitutionalized population with a disability: 9.0
- Percentage of persons who lived in the same place this year as last: 82.7
- Percentage of population born outside the U.S.: 21.8
- Percentage of workers who drive alone to work: 78.8
Who carpool: 12.1
Who take public transportation: 2.2
Who walk: 1.5
There’s more!
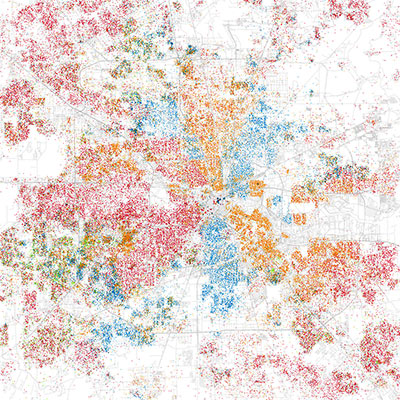
Inspired by a similar map published earlier this year and meant to help visualize the segregation of Chicago’s neighborhoods, dot-happy data explorer Eric Fischer has now produced similar maps for 102 U.S. cities. Here’s his map of Houston — which we’ve taken the liberty of darkening a bit to make patterns more apparent. The maps are based on ripe old data from the 2000 Census, the dots colored according to the racial and ethnic categories provided by respondents. Each red dot represents 25 White people, each blue dot 25 African Americans, each green one 25 Asians, each orange one 25 people identifying themselves as Hispanic. “Others” are rendered in gray.
- Race and ethnicity [Flickr, via Gizmodo]
- Chicago Boundaries [Radical Cartography]

