04/03/13 10:15am

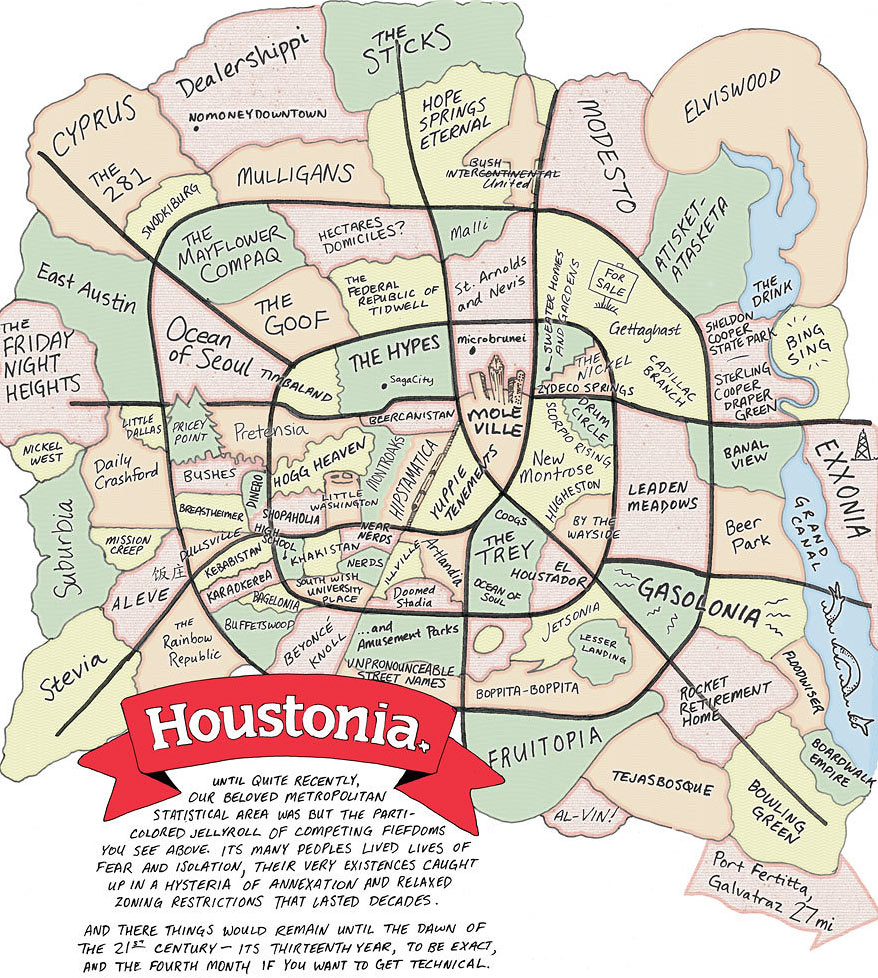
Map of Houston from Houstonia Magazine

This is a Houston that no one’s ever seen: The lines in the swamp have been drawn for new monthly magazine Houstonia’s inaugural issue, which landed on newsstands last Thursday. This map’s “competing fiefdoms” suggest what’s really happening here: Those of you north of I-10 are now making a home in “The Hypes.” And that up-and-coming former industrial wasteland east of Downtown’s been dubbed “New Montrose.” West of the Galleria? That’s “Breastheimer.” South of I-10 near Memorial Park and the Loop is “Hogg Heaven” and “Pretensia,” just east, of course, of the mansions in “Pricey Point.” And Midtown’s been divided by the light rail, split into West “Hipstamatica” and East “Yuppie Tenements.”

Drawing: Dan Derozier

03/18/13 10:15am

Where’s all the new office space in Houston? Here, reports Metrostudy’s David Jarvis. The lemming-like red dots cramming together on the Beltway and Katy Fwy. out toward the Grand Parkway denote locations that are already under construction, totaling 12.5 million square feet of new office space. The green dots denote planned locations that would add 6 million more. The ExxonMobil campus up near the Woodlands, reports Jarvis, accounts for almost half of the new construction.

Map: Metro Study Report

03/12/13 2:00pm

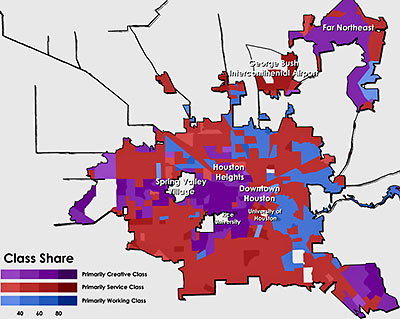
This map from Rise of the Creative Class author Richard Florida’s series at The Atlantic on “class-divided cities” shows where Houston’s working, service, and creative classes live.

Denoted here in purple, what Florida considers the creative class — that is, he writes, “people who work in science and technology, business and management, arts and culture, media and entertainment, and law and healthcare professions” — makes up 33 percent of Houston’s workers; that’s just a little bit larger than the national average, according to Florida, of 32.6 percent.

And what about the service and working classes?

CONTINUE READING THIS STORY

03/06/13 11:30am

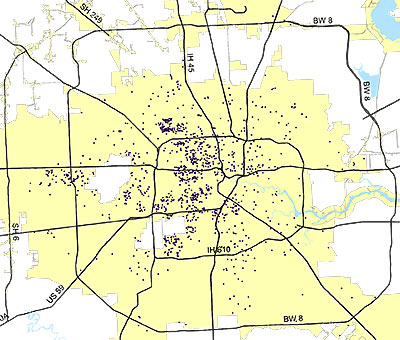
Each of these purple specks — or black holes, depending on your perspective — represents a demolition permit issued by the city in 2012. The planning and development department has posted this and a few other maps online with an overview of demographic data.

After the jump, you can see in more detail the demos inside the Loop from 2012 and 2011, juxtaposed with other maps showing the permits for single- and multi-family construction. You know. For balance:

CONTINUE READING THIS STORY

09/14/12 4:18pm

COMMENT OF THE DAY: A FEW BUMPS ON THE WAY TO A HOME SALE “There is a decent fault line map at this url. Much more than this and you would need to contact the GIS department at Harris County Flood Control (I think). The Long Point fault is interesting. More interesting to me was the Pecore fault in the Heights. I bought a home with no disclosure from the prior owner or the inspector. All the neighbors knew but I did not know them. Went to sell it after remodeling the property and it comes up. Obvious when I drive that area now. Ultimately it was a disclosure item but not an issue at sale.” [sboney, commenting on Yards of Yard in Britmore Oaks]

08/31/12 3:53pm

AN UPDATED GUIDEBOOK TO HOUSTON BUILDINGS NEW AND THROUGH The third edition of the Houston Architectural Guide won’t be available officially until October 8th, but the Houston AIA is now taking pre-orders through September at a discounted price (PDF). The latest version of the encyclopedic catalog and tour guide, updated by Stephen Fox, will include 340 new entries covering structures that have popped up in the last 13 years — plus a whole bunch more from the last edition, moved to the back-of-the-book “now demolished” section. [AIA Houston]

07/27/12 11:21pm

COMMENT OF THE DAY: MAKING IT UP WITH QUANTITY “Using numbers to determine what is ‘cool’ is a waste of time. One of the criteria used in the article was the number of pro and college sports teams in the city. Ok, fine, but do you really think the Astros are as ‘cool’ as the Yankees, Cubs, or Red Sox? Yet quantity wise, they each count as 1 and are considered equal. The same goes for museums. Is the MFAH really as cool as the Met? This exercise could be done for any of the categories Forbes used to rank the cities and Houston would come up short on almost all of them. So while Houston may be the coolest when you count numbers, its certainly not the coolest when you’re looking for the coolest things around.” [Walt, commenting on Headlines: Houston as America’s ‘Coolest’ City; Predicting Traffic Jams]

06/22/12 12:10pm

A JUST-OPENED SOURCE FOR HOUSTON BUILDING DATA A 3-month-old website that aims to collect and broadcast detailed information about existing buildings — including photos, square footage counts, ownership and management contacts, projects and renovations, and LEED certification levels — opened its catalog of Austin, Dallas, and Houston commercial and mixed-use structures this week. HonestBuildings.com claims to have detailed online profiles already available on a total of 95,000 buildings in those 3 Texas cities, and on a total of 475,000 nationwide. Many of the Houston listings contain only cursory info so far, but the company is hoping local building managers will provide details to fill out the extensive list of data categories. The New York and Seattle-based startup appears to focus on issues of energy efficiency, allowing companies that provide related services to showcase and target their work — and users to compare building data.
06/14/12 9:45am

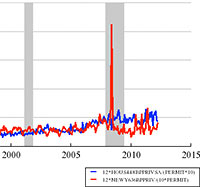
WE’RE BUILDING MORE HOUSES IN HOUSTON “The New York Metro areas has more than 3 times as many workers as the Houston metro area,” notes UNC professor and Forbes economics blogger Karl Smith after looking at a bunch of graphs, “but can’t keep up with the pace at which Houston is permitting new housing.” One of the several charts Smith assembled from Federal Reserve data shows that the number of construction permits issued in the Houston metro area surged ahead of the number issued in the New York-New Jersey-Long Island area beginning toward the latter end of 2007, just as the recession hit, and has stayed ahead. (The pace of new permitting in both cities accelerated in 2005, but fell off in New York a couple years later, after a big spike.) Over the last couple of years the Houston area has accounted for between 3.5 and 6.5 percent of all newly issued U.S. housing units. [Forbes]
01/24/12 2:47pm

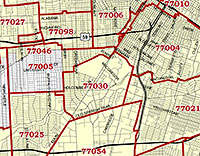
THE NEW ONLINE HOME OF HOUSTON’S MAP TOP TEN Zip Code maps, super neighborhood maps, crime maps, city boundary maps — if there’s a city-produced map of Houston you’re looking for, you’ll find it at the planning dept.’s just-unveiled My City Maps and Apps page. The page is peppered with (mostly working) links to the city’s main GIS My City map viewer (newly updated with 2010 aerial photos) and other services such as the still-in-beta, still Internet-Explorer-only electronic Development Review Cycle system for tracking platting, variance, and development applications. [Planning Dept.]

09/13/11 10:10am

National attention may be focused on Central Texas-style barbecue, but food writer J.C. Reid says it’s time to put Houston barbecue back on the map. Logical first step in his Houston Barbecue Project, then: this interactive map of urban BBQ joints within Beltway 8. The project’s mission: “to revisit, document and recognize the East Texas-style of barbecue as it is embodied in the urban barbecue joints of Houston, Texas.” Reid drew the Beltway boundary just to limit the project’s first phase — he’s writes that he’s interested in expanding exploration to Houston’s outskirts and beyond once he — and any fellow BBQ adventurers — are able to document more of this city’s smoky inner sanctum.

What about the argument that city of Houston health and environmental codes are incompatible with good barbecue?

CONTINUE READING THIS STORY

08/25/11 2:25pm

If y’all had come to Space Center Houston, they’d have built a home for a retired space shuttle there. Well, maybe. Today’s report of the NASA inspector general points out a few details in the story of how Houston lost out in the retired-space-shuttle home sweepstakes. At a presentation given to NASA administrator Charles Bolden in November 2009, 4 out of 5 options being considered at the time by the agency’s recommendation team would have given Houston a shuttle. And Bolden says Houston was a sentimental favorite for him, too. He told investigators

that if it had been strictly a personal decision, his preference would have been to place an Orbiter in Houston. He noted that “[a]s a resident of Texas and a person who . . . spent the middle of my Marine Corps career in Houston, I would have loved to have placed an Orbiter in Houston.”

So what happened?

CONTINUE READING THIS STORY

06/16/11 12:20pm

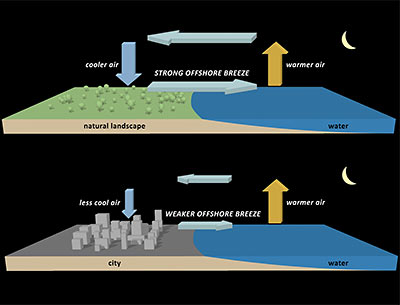
A new study from the National Center for Atmospheric Research documents how Houston’s vast expanse of paved surfaces allows the city to hold onto locally developed air pollution for longer periods of time, and prevents breezes that would otherwise naturally develop from sending all that nasty smog and stuff to outlying areas. Concrete and asphalt paving helps by soaking up heat during the daytime. This keeps land areas relatively warm overnight, which means there’s a lower contrast between land and sea temperatures during the summer. The result? Much less of those smog-stealing nighttime summer breezes. During the daytime, Houston buildings help to block local winds and keep things more still in the afternoon. Just another way standard development practices allow Houston to be a responsible steward of its own locally produced airborne products.

CONTINUE READING THIS STORY

06/14/11 2:29pm

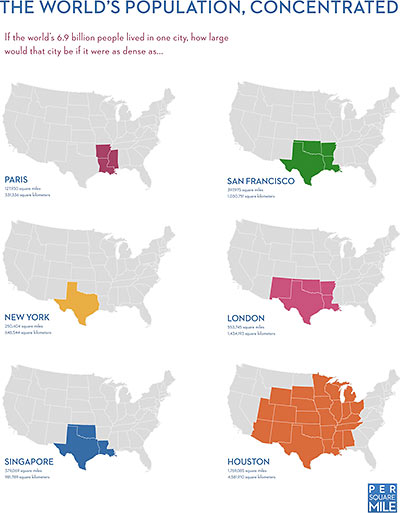
Houston wins again! If the world’s current population — all 6.9 billion of us — were packed into a city as dense as Paris, or Singapore, or New York, or San Francisco, just look how piddly it would be. This handy chart from Tim De Chant’s Per Square Mile blog shows how sad, too: The Gateway Arch in St. Louis would probably get lonely, and the Minnesota Twins would lose their all their fans. But what if we all spread ourselves into a city with Houston’s density? Much better, this:

CONTINUE READING THIS STORY

06/08/11 9:30am

PARKER: HOUSTON LOTS MUCH BIGGER THAN WE THOUGHT Acknowledging that the city underestimated the cost of the average homeowner’s drainage fee by $3.25 per month, Mayor Parker blames faulty estimates of the size of the typical Houston residential lot. The city had presumed that the average Houston home had a 1,875-sq.-ft. impervious footprint and sat on 5,000 sq. ft. of land. But appraisal district data and satellite images now show that the typical Houston home sits on a 7,500-sq.-ft. lot and has 2,850 sq. ft. of impervious surface. [Houston Chronicle]