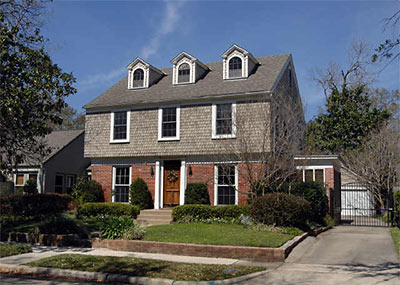
SURVIVAL OF THE FITTEST “The days are long gone when sales were so brisk that everyone from accountants to lawyers snapped up empty lots to build homes in Houston, where loose laws meant at the height of the property boom anyone could be a builder. . . . Mike Salomon, president of Sandcastle Homes, however, says those unprepared for an inherently risky business have been chased out of the industry. ‘We’ve gone from a market that was very forgiving, and you could make mistakes and still be profitable,’ he says. ‘We’re close to what it should be like, where people who don’t know what they are doing are going out of business.’ His profits were down by 30 to 40 per cent in 2008, but volume was up 37 per cent. ‘We have to do more stuff to make the sales, but we have a profitable business that we’re still running.’” [Financial Times, via Swamplot inbox]
Tag: Houston Data

From the website of New York graphic-design office Thumb:
This poster is designed as a sort of calling card for Rice School of Architecture, located in Houston. We collected ring roads from 27 international cities and layered them all at the same scale. As it turned out, Houston has the largest system of those we surveyed. (Beijing was second)
- Ring Roads of the World [Thumb]
Poster: Thumb

More comments on Greenwood King’s April market report, which focuses on real estate activity in Houston’s higher-end neighborhoods. A second reader focuses on prices, determined to find storm clouds in the report’s silver lining:
While some avg. sales prices are higher, this is most likely due to builders no longer buying lots to build on for b/t 400 and 500k.
Last week you had a poster ask to see the evidence of price declines and an eroding market. Here is further evidence of a declining market. Moreover, the poster requested to see comps that show declines. I think I have proof. Can we get a Realtor to confirm that a prime West U. property–3128 Lafayette–sold for 700,000 over two years ago and now has been recently reduced to 699,000. Welcome back to 2007–[how] much further do we have to go?
One problem with finding these declining comp examples (and I think there are more, and more on the way), is that the Realtors control all of the data and are reluctant to admit that the prime inner loop area that has been so good to them is begining to substantially turn negative.
- April Houston Market Report (PDF) [Greenwood King Properties]
- Greenwood King April Report: Getting a Little Crowded at the Top of the Market [Swamplot]
- Comment of the Day: Show Me the Deals!
Photo of 3128 Lafayette St. in West University: HAR
Swamplot readers have a few things to say about Greenwood King’s latest fancy-neighborhood market report, which came out yesterday! Our regular GK watcher notes that the separate breakdowns for new construction and existing home sales introduced in last month’s edition have been abandoned. Still:
The news is relatively bad. Sales volumes are down sharply all over town. 17% more high end listings than last year . . . River Oaks, Tanglewood, Boulevard Oaks, and Memorial Close In are all over 12 months of inventory. . . .
The 17% higher inventory is reflective of a market of motivated sellers. By definition, a high end homeowner should not “have to†sell unless there has been a life change (divorce, death, job interruption). Everyone knows the housing market is weak in 2009, so…. the only class of sellers on the market are those having cash flow problems or those who have to sell due to a life change. There are almost no trade up sellers right now.
Memorial has 19.1 months of inventory
. . . as big $3-5 million white elephants sit there waiting for the landscapers to come and cut the lawn for the week. It takes a good $20,000 a month to live in one of those monsters. I guess the supply of willing millionaires just isn’t going to match the number of mega mansions. It will take some time, but they will soon move onto bank balance sheets and then to the auction block.
COMMENT OF THE DAY: SHOW ME THE DEALS! “I would like to ask you to show us how right you are by pointing me to some properties inside the Loop that could be purchased for 2005 prices. I have buyers. Really ready finance-able buyers. Of course, you had better send me a lot, or my buyers will bid your properties up to a price past 2005 prices in a heartbeat. So, let me at them. I am ready. I search the market constantly, and would love to present these ‘2005’ deals to my buyers, but I am not seeing them. . . .” [Harold Mandell, commenting on Popping That “No Housing Bubble in Houston†Myth]

Enjoy your spring, everyone! Armed with a few pointed charts fueled by the latest data from HAR, Swamplot’s spreadsheet-wielding correspondent writes in again, this time with comments on March’s residential real-estate market report:
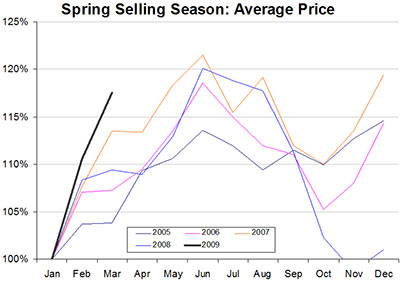
The Realtors always speak breathlessly of the “Spring Selling Season†with an almost religious reverence. Well it shows in the data. Home sales are 60-100% higher in the warm weather months. Prices are 10-20% higher, too. . . .
The Swamplot reader who’s been focusing on Greenwood King Properties’ monthly market reports has spotted some problems in the latest sales data. The latest report, for the first time, provides separate totals for new homes and resales:
If dollars fall by more than units, then price has fallen.
If you add together 2 significant segments and one is lower and one is flat then the total is lower.
The quick math doesn’t work!!!

How can Flat+Down=Flat??
How can -38% dollars and -33% transactions = Flat??? It implies lower prices…
So now I have a report that raises more questions than answers. Total sales prices are flat? Resale prices are flat? ALL of the pain is in new construction?
Price has always followed volume in every market around the country. So are the price drops for resales ahead of us now? The average resale high end home in Houston is now $585,000??? Isn’t that LOT VALUE in most of these neighborhoods? We never got the news on what happened over the past 3 or 4 years on resale only. Were prices actually flat on the way up?
A few more comments on looming problems in the market for high-priced homes:
Swamplot’s Greenwood King-watching reader informs us that the real-estate firm’s March survey of home sales in Houston’s tonier neighborhoods is already out — early, this time. And this month the report details separate data for new construction and resales. Snarks the GK watcher:
This is a typical reaction of the Realtors to falling prices. Find a way to re-segregate the market to make the bread and butter look OK. Last year it was “Inside the loop never goes down!†Pretty soon we will see the market cut into “Three Story (-34%) Two Story (-2%) and One Story (-26%) homes.â€
Hmmm . . . not a bad idea! But what about the new numbers?
COMMENT OF THE DAY: AFTON OAKS AFTERTHOUGHT “Maybe a light rail stop would help to staunch the bleeding.” [Nord, commenting on Plenty of Expensive Homes for Sale in Afton Oaks]
PLENTY OF EXPENSIVE HOMES FOR SALE IN AFTON OAKS Judy Thompson updates the neighborhood stats: “The Zip Code Feeling the Most Pain is . . . . definitely 77027, the Afton Oaks area. Today’s market condition update shows six of its eight price ranges to be . . . a buyer’s market. This is happening at the high end, a result of so much redevelopment during the past decade. This zip code also experienced the highest appreciation in recent years in price per square foot paid so you might say they experienced a slight ‘bubble’ that is now bursting.” [Strictly a Buyer’s Agent]
The Houston Chronicle‘s annual neighborhood-sales-data extravaganza came out this weekend. Since it covers the 2008 calendar year, the survey is timed just right to document the continuing drop in sales and prices of far-flung lower-priced homes — but maybe a bit early to catch the extended Wile E. Coyote-style midair hang a fair number of closer-in half-a-million-plus homes on the market are currently experiencing.
A few highlights:
Sales activity dropped in all counties for non-foreclosure transactions. All counties showed a rise in sales of foreclosed homes.
And those foreclosures are also clearly missing the bullseye: In 2008 there were only 362 foreclosures inside the Loop and 2,556 between the Loop and Beltway 8 — but a whopping 9,342 outside the Beltway. In total, foreclosures were only up about 11 percent over the previous year. But the number of non-foreclosure sales dropped by almost 22 percent. So in 2008 foreclosures accounted for just under 22 percent of all sales.
Where did the prices fall last year?
Note: Story updated below.
A Swamplot reader writes in one day early, mighty eager to get a glance at the latest Houston real estate numbers:
It seems that things must be so bad in the high end that Greenwood King’s monthly market report isn’t even out for February -and it is April!
It is basically soft core porn for real estate watchers. A girl friend of mine simply emails me an excited ‘ITS OUT!!!’ whenever it is posted.
This report is watched by everyone, because it provides a focused glimpse into the city’s Better Homes and Gardens. It is a very exclusive party list. When riff raff is even allowed in the party, it is neatly segregated from the other data: I guess “Montrose (Townhomes)” is allowed in just because it is a quirky and fun guest and “Montrose (Single Family)†needs someone to talk to.
HCAD APPRAISALS: THE $500K DIVIDE 45 percent of the 860,000 single-family-home appraisals completed by HCAD so far this year show a lower market value than last year; 39 percent are the same, and 16 percent have gone up. “‘Appraisal value is down about 2.5 percent (overall),’ said Assistant Chief Appraiser Gus Griscom of the completed figures. . . . Homes valued at $500,000 or more received the highest percentage of actual value increases. Homes valued at $250,000 or less were given the highest percentage of value reductions. Overall, of the statements currently being mailed, homes valued at more than $500,000 saw their market values increase on the average anywhere from 5.17 percent at the lower end to 5.81 percent for homes valued at $1 million or more. The above-$500,000 valuation group accounts for a little more than 3 percent of the appraisals being mailed.” [River Oaks Examiner]
YEAH, BUT HOW MANY ACRES DID THEY BRING? More than one million new residents moved to the Houston-Sugarland-Baytown Metropolitan Statistical Area between 2000 and 2008, according to a report released by the Census Bureau today. That puts the local area population at a little more than 5.7 million. “The Houston metropolitan area added more than 130,000 residents between July 1, 2007 and July 1, 2008, the second-highest number in the country after Dallas-Fort Worth, the bureau said. Among counties, Harris County added more than 72,000 people, trailing only Maricopa County, Ariz., in growth in sheer numbers.” [Houston Chronicle]

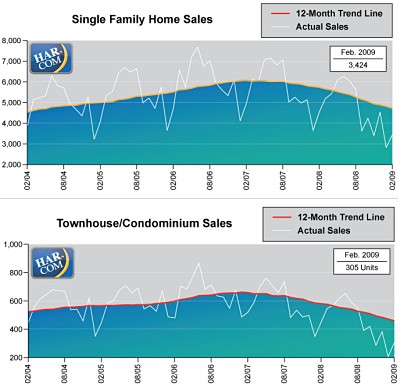
Looks like HAR has responded to some Swamplot reader criticism and added a bit of needed real estate to the bottom of the charts in its latest report — as well as a thin white line to indicate actual, non-adjusted values. The changes and the addition of the latest numbers show a market that doesn’t seem quite so steady as last month’s HAR report made it seem.
There were 25.9 percent fewer property sales this February than last, according to the report. But our reader’s 3-month-moving average chart doesn’t look any worse than last month:

