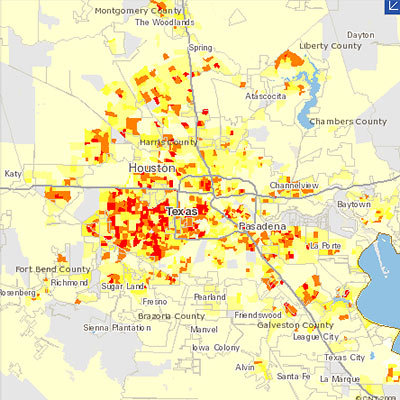
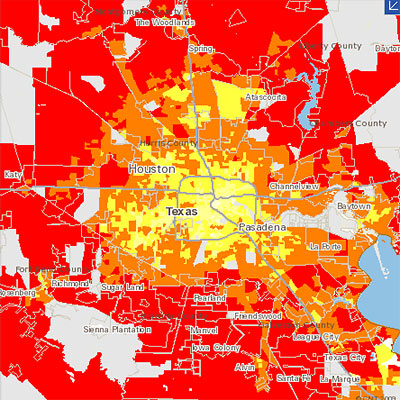
The Center for Neighborhood Technology has updated its interactive region-comparison website to show data comparing carbon dioxide emissions around the Houston region. The Housing + Transportation Affordability Index now allows you to compare CO2 emissions — from “household vehicle travel” only — on side-by-side zoomable maps.
The 2 new data sets available show CO2 emissions per acre (at the top above), and CO2 emissions per household (directly below that) from household auto use. The Houston-Galveston-Brazoria region is one of 55 U.S. metropolitan areas mapped on the website. The center’s point?
When measured on a per household basis, it found that the transportation-related emissions of people living in cities and compact neighborhoods can be nearly 70% less than those living in suburbs.
The center figures that transportation accounts for 28 percent of all greenhouse gas emissions in the U.S.
Other H+T map tools focus on how affordable different locations are to live in — when you take transportation costs into account:
CONTINUE READING THIS STORY

