YEAH, BUT HOW MANY ACRES DID THEY BRING? More than one million new residents moved to the Houston-Sugarland-Baytown Metropolitan Statistical Area between 2000 and 2008, according to a report released by the Census Bureau today. That puts the local area population at a little more than 5.7 million. “The Houston metropolitan area added more than 130,000 residents between July 1, 2007 and July 1, 2008, the second-highest number in the country after Dallas-Fort Worth, the bureau said. Among counties, Harris County added more than 72,000 people, trailing only Maricopa County, Ariz., in growth in sheer numbers.” [Houston Chronicle]
Houston Data
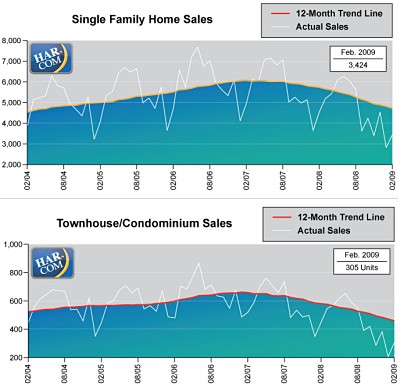
Looks like HAR has responded to some Swamplot reader criticism and added a bit of needed real estate to the bottom of the charts in its latest report — as well as a thin white line to indicate actual, non-adjusted values. The changes and the addition of the latest numbers show a market that doesn’t seem quite so steady as last month’s HAR report made it seem.
There were 25.9 percent fewer property sales this February than last, according to the report. But our reader’s 3-month-moving average chart doesn’t look any worse than last month:
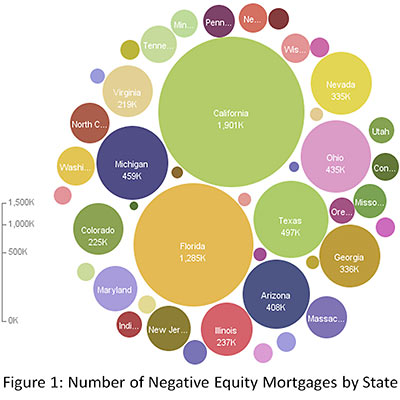
Sure is nice for us Houston didn’t get caught up in that big price run-up housing markets in the rest of the country fell for! That’s why in Houston real estate is in much better shape than it is everywhere else, right?
Not according to a study released yesterday by First American CoreLogic. The research firm estimates that 18.3 percent of all mortgaged properties in the Houston-Sugar Land-Baytown region are in a “negative equity position,” and another 6.7 percent are within just 5 percentage points of being there. “Negative equity,” AKA “I’ve fallen down and I can’t get up,” means a mortgage holder owes more than the underlying property is worth.
In other words, 1 in every 4 Houston-area mortgages is already in deep doo-doo.
But hey, all it’ll take to recover is for prices to rise a little! And the rest of the country is doing much worse, right?
KATY AND THOSE NEW HOME GROWTHS “Houston is the largest home-building market in the nation, according to the Greater Houston Partnership and Builder and Hanley Wood Market Intelligence, with 42,697 building permits. Population trends, job growth, home prices and the rate of building permits all factored in to rank the top 75 markets in 2008. Assisting the numbers, no doubt, was Katy. Business Week magazine ranked Katy as the second-fastest residential community in the U.S. in a study published this month titled ‘America’s Biggest Boomtowns.’ The study was based on new home growth from 2000 to 2008.” And what will next year’s numbers say? [Houston Business Journal]
LAS VEGAS TO HOUSTON: WHAT ARE THE ODDS? A Swamplot reader requests a long hard look at the Houston housing market crystal ball: “Do any ‘experts’ lurking among Swamplot’s readership have any thoughts on long-term residential price trends in Houston? Me and the missus were trying to sell our home in Vegas (good house, great neighborhood, bad timing). Now we will be holding on to it until the Vegas market starts coming back — whenever that is. I’m trying to get an idea on what prices could look like when we finally have the funds to buy locally (6 months – 1 year, depending). Any info or sites that might help us answer those questions would be greatly appreciated.” [Swamplot inbox]
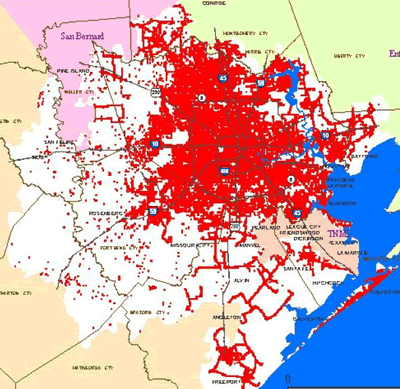
From the company’s website: a current (as of this morning) map of Centerpoint Energy power outages resulting from Hurricane Ike.
It sure looks a lot like Houston.
- Outage and Restoration Updates [Centerpoint Energy]
HAR MONTHLIES: SALES DOWN, PRICES UP “Of 41 Houston-area regions tracked by the Houston Association of Realtors, sales of single-family homes in June were up in seven and down in 34 from a year earlier. The median home price was up in 18 of the 41 regions. The median home price overall in the Houston area was $162,000, up 1.3 percent from a year earlier.” [Houston Chronicle]
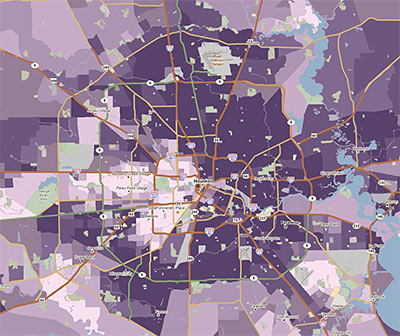
Here’s a tool likely to be useful to armchair developers interested in the lay of the land. PolicyMap is a new GIS website that allows you to view a range of local market and demographic data for Houston or any area of the country. You can see how local crime statistics, an interesting array of mortgage categories (such as the percentage of piggyback, subprime, and refi loans), income distributions, and even donations to presidential candidates look on a map. (Big surprise: Pearland and the Energy Corridor really like John McCain!)
PolicyMap is a project of The Reinvestment Fund, a non-profit community-development financial institution from Philadelphia. Some of the advanced features require a subscription, but there’s plenty to play around with for free.
The quick map above shows what Houston areas took out the most subprime loans in 2006. (The darkest purple means more than 50% of all mortgages funded that year.) If you discover more interesting neighborhood stories demonstrated nicely in PolicyMap maps, share your finds in the comments.
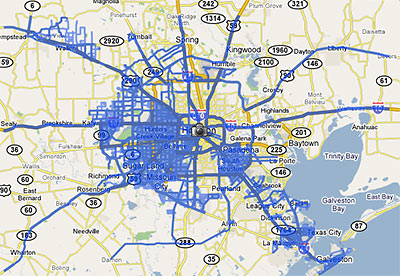
Last week Google rolled out a major update of its Street View feature, adding 13 new cities and a national park, and expanding its coverage in 6 cities . . . including Houston. The map above shows the extent of the Houston street-level photos now available through Google Maps.
Previously, street views from Google Maps were available only from major thoroughfares in the Houston area. Now, they are available on just about every street . . . within the areas marked in blue. South Houston, plus areas west of 290 and 288 outside the Loop are now mapped street by street. But most inside-the-loop neighborhoods are still left out.
Strangely, this means Google Map addicts can stalk Cypress subdivisions virtually street by street, but views of Southampton are limited to sideways glances from Shepherd and Bissonnet.
After the jump: a sampling of the new street-level views of westside neighborhoods!
 Sure, there’s the latest numbers out from the Houston Association of Realtors, showing a continuing decline in home sales in October, an 8 percent upswing in the average number of days homes have sat on the market, and a slight drop in the median home price compared to this time last year.
But the most blatant sign that serious problems in Houston housing have already arrived is the new promotional blitz just unleashed by the Greater Houston Builders Association — telling us all not to panic: Everything’s just rosy in the wonderful world of Houston residential real estate. Hey, everybody back in the water!
The PR push, which includes a blanketing of radio and TV spots in local markets, is designed to reassure nervous would-be buyers that now’s the perfect time to buy a home way out on the latest subdivision frontier, even though lots of scary signs have been suggesting otherwise for quite a few months now. The heart of the homebuilders’ campaign is the ominous-sounding HoustonFacts.org website, which fills Houston homebuyers’ ears with fact-filled, sage advice like this:
If you try to wait and time the market until it hits rock bottom, you are likely to lose out. Just as no one can accurately predict the peaks and valleys of the stock market (name one person who sold their tech portfolio in April of 2000), the same holds true for housing. If you sit on the fence and wait for the absolute best deal, you could end up literally waiting for years. And most likely, your guess on market timing would be wrong. But if you choose to buy now, you will not only be in the driver’s seat during the buying process, you will also reap the gains of price appreciation once you become a home owner. Remember, those who purchased homes in the early 1990s during the last big economic and housing downturn came out as big winners.
There’s lots more of this kind of wisdom available on the site, but here’s a special challenge to eagle-eyed Swamplot readers: See if you can find the comparison of a home investment to a stock-market investment on the site that simplifies all those messy calculations by leaving out the cost of monthly mortgage payments and expenses!
Keep reading for a HoustonFacts.org tip on home foundations for the Houston climate!

Google has just added its Street View feature to Houston Google Maps. This means that you too can experience what it’s like to drive around parts of this city with a 360-degree camera mounted to the top of your Chevy Cobalt—all from the privacy of your own computer.
Google first rolled out Street View in May for the San Francisco Bay Area, New York, Las Vegas, Denver and Miami. Several websites have sprung up to document interesting streetlife recorded by Google’s cameras.
For Houston, of course, Street View is much more exciting: at last, online photos of all your favorite strip centers, parking lots, and freeways. Occasionally a pedestrian gets in the way to mar a view, but most of the shots are much cleaner.
- More Street View Cities [Google Lat Long Blog]
- Google Streetview Camera Vehicles Spotted All Over US [Gizmodo]
After some “research,” Forbes declares Houston the fourth-best place to flip a house. Meanwhile, Forbes Traveler says Houston is the ninth-most-visited city in the U.S.
Coincidence? Or has Forbes simply stumbled upon the awful truth about our city: visitors, upset by a lack of tourist attractions, have turned to quick real-estate thrills instead.
Maybe that explains the Tremont Tower train wreck.
- Best Places To Flip A Home [Forbes, via Curbed LA]
- America’s 30 Most Visited Cities [Forbes Traveler, via HAIF]
- The Dirty Little Secret Behind the Montrose Foreclosure Hump [Swamplot]

The Trust for Public Land’s annual report on parks in cities is out and—guess what! Houston miraculously has a whole lot more parkland than it did last year.
In 2006, the Trust’s report showed Houston had 16.5 acres of parkland for every 1,000 residents—below the 20.6-acres-per-1,000 average for cities of similar density.
This year, Houston looks a whole lot better: Suddenly, there’s 27.2 acres of parkland per 1,000 residents. That puts us in third place among cities in the “intermediate-low density” category, and well above the new 17.5 acre average.
How’d it happen? Was it the new 11th Street Park? A secret citywide playground-building program? Not quite. It’s the creative accounting effort launched by Mayor White’s office to make sure the Trust counted every green acre.
White simply wanted Houston judged by the same criteria as other cities, [spokesman Frank] Michel said. “As the mayor likes to say, the facts are our friends.”
Where did the mayor find all that green? Well, here’s his biggest catch:
. . . the city argued successfully that the surface area of Lake Houston — almost 12,000 acres — should be counted as parkland. Harnik said the trust agreed that bodies of water should be counted if they were associated with a park owned by a government agency. Houston acquired the 5,000-acre Lake Houston Park in August 2006 from the state parks department.
Too bad we were limited to just the surface area, though. Next year’s report will probably be even better. Isn’t there a city park somewhere associated with the Ship Channel too?
- Study says Houston ranks among metro leaders in green space [Houston Chronicle]
- City Park Facts [The Trust for Public Land]
- In a Paved Paradise, No Need To Put Up with a Lot of Parks [Swamplot]
- West 11th Street Park: Saved by the Bill [Swamplot]
Lake Houston Photo: Flickr user Demonhawk.
Some highlights from the Chronicle‘s annual housing-price survey extravaganza, published Sunday:
- Yeah, prices were up again last year, growing steadily since 1992 (a good year to start with if you’d rather forget Houston’s big busts). But price increases slowed down in the second half.
- Anyone needing proof that Houston is still a donut need only glance at this map of sales activity inside and around the Loop and Beltway. We love that creamy filling as much as anyone, but there’s more dough to be made at the edges (eighty percent of sales are outside Beltway 8).
- The front-page graphic, which at first glance appears to show steeper historical price growth for inside-the-loop homes (and a better rate for them this year), is a little misleading: Except for last year, average percentage price increases since 2001 have been highest outside the loop.
As usual, specifics on last year’s neighborhood price trends are hidden in the Chronicle‘s Homefront section.
- Houston area home prices continue to climb [Houston Chronicle]
- Homefront [Houston Chronicle]

