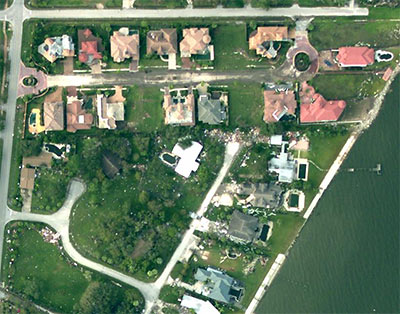
Having trouble finding photos of your Iked house on Flickr? Try finding it from the air, using NOAA’s brand-new aerial photos, taken only a few days after Hurricane Ike.
Aerial photo of Villa Dr. in Seabrook after Hurricane Ike: NOAA

Having trouble finding photos of your Iked house on Flickr? Try finding it from the air, using NOAA’s brand-new aerial photos, taken only a few days after Hurricane Ike.
Aerial photo of Villa Dr. in Seabrook after Hurricane Ike: NOAA
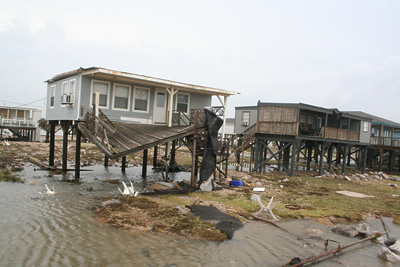
Thanks to the efforts of a volunteer firefighter, banished Surfside Beach and Surfside Shores residents may be able to view their homes on Flickr. Former New Orleans resident Adam P. Devaney has taken more than 800 photos of surviving homes in the area, though he’s only halfway through with the uploading.
Devaney, who has taken photographs as a hobby for about 10 years, said he did not zero in on the most dramatic damage, but rather tried to document the entire landscape. He estimates he has photographed bout 95 percent of Surfside Beach since Ike’s landfall.
He will try to photograph the beachside communities of Treasure Island and San Luis Pass later this week at the request of some homeowners. He tried to enter Treasure Island on Tuesday, but was turned away by Brazoria County Sheriff’s deputies, who are keeping the area off limits, due to severe storm damage.
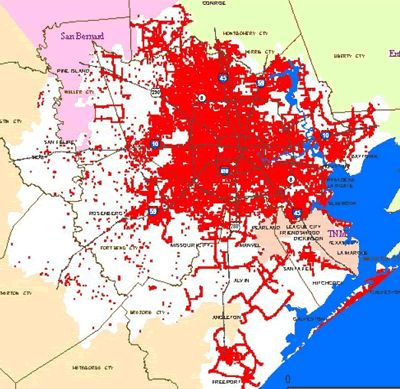
From the company’s website: a current (as of this morning) map of Centerpoint Energy power outages resulting from Hurricane Ike.
It sure looks a lot like Houston.
Here it is, the bastard brainy child of those old David Hockney photocollages and Quicktime VR: Microsoft Photosynth. Someday, maybe, it’ll revolutionize online real-estate gawking. For now, though, it just looks kinda cool.
OFF-MAP JOGGING IN GLEANNLOCH FARMS Another lost jogger, rescued by iPhone. But what happens when Google Maps fail? “Every time I am in Houston I am filled with renewed trepidation over the in-laws neighborhood. It’s lovely, of course, but it’s also a Houston suburbs’ subdivision. Despite having visited numerous times over the course of the past three and a half years, I am remarkably unable to maintain any sense of cardinal directions or relative location once we enter the sprawling land of pale-red-and-cream houses in well-manicured cul-de-sacs with nice names.”
Houston’s Downtown wireless-access experiment is now up and running, with a network of 20 free hotspots, identified in the city’s interactive map above. The hotspots offer download speeds of up to 2Mbps and uploads of up to 1Mbps, which is in the ballpark of cable and DSL service. Brave iPhone tester (and Chronicle Tech columnist) Dwight Silverman reports coverage is pretty spotty between Wi-Fi hotspots:
I’d get a decent signal on my iPhone in one block, then turn a corner and get bupkis. But if I walked a few more feet, I could usually get enough of a connection that I could check e-mail.
Silverman also offers this tip:
If you want a good connection and you’re not near a hotspot, look for one of the dual-antenna access points mounted atop street lights. Get close it for a stronger signal.
Map: Houston WiFi
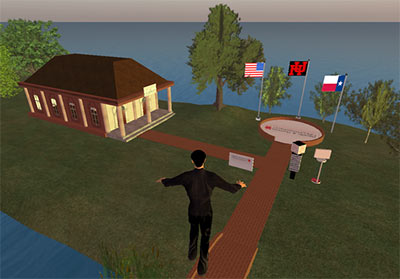
The University of Houston is buying an island on Second Life! It’ll be used for the school’s Department of Health and Human Performance and the Texas Obesity Research Center.
Plans call for an interactive campus where students and professors adopt avatars to walk (or fly) around campus or teleport to any number of thousands of other islands.
Virtual doesn’t come cheap. UH paid $1,700 for the island and pays Linden Research another $300 a month in rent.
Not cheap?? You try renting an entire campus for $300 a month. You could hardly get a dorm room for that. But the best thing about UH’s new space is clearly its high quality design.
A virtual architect designed and built the campus as a very, very loose replica of the real thing “with better architecture,†says Associate Professor Brian McFarlin.
After the jump: More views of the beautiful UH-Virtual!
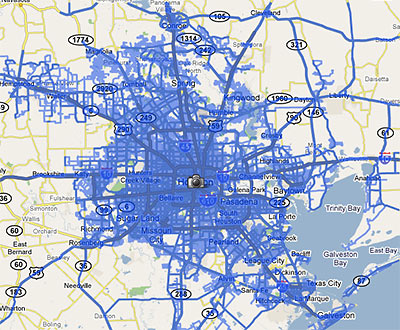
When the Street View feature was first introduced to Houston Google Maps about a year ago, it allowed viewers to follow street-level photos . . . mostly along major thoroughfares. In March, Google added street-level views of residential neighborhoods within a huge swath of West Houston and Pasadena . . . but the update still left out most areas inside the Loop.
This week, a tipster informs us, Google has expanded Street View again, updating its database with photos taken from almost every street inside the Loop . . . and this time including most areas inside the Beltway and beyond as well. The map above shows the extent of the new coverage.
Smile! Photos of your home are likely now on the internet . . . unless you live in a few special areas in town . . .
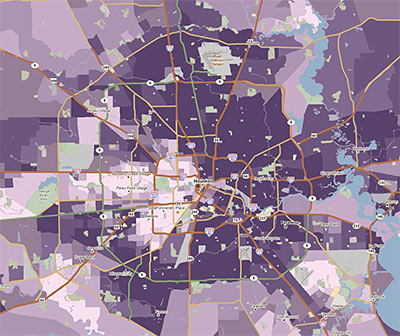
Here’s a tool likely to be useful to armchair developers interested in the lay of the land. PolicyMap is a new GIS website that allows you to view a range of local market and demographic data for Houston or any area of the country. You can see how local crime statistics, an interesting array of mortgage categories (such as the percentage of piggyback, subprime, and refi loans), income distributions, and even donations to presidential candidates look on a map. (Big surprise: Pearland and the Energy Corridor really like John McCain!)
PolicyMap is a project of The Reinvestment Fund, a non-profit community-development financial institution from Philadelphia. Some of the advanced features require a subscription, but there’s plenty to play around with for free.
The quick map above shows what Houston areas took out the most subprime loans in 2006. (The darkest purple means more than 50% of all mortgages funded that year.) If you discover more interesting neighborhood stories demonstrated nicely in PolicyMap maps, share your finds in the comments.
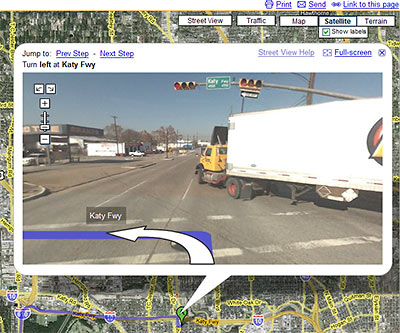
Google has just added street-level photos to the driving directions available on Google Maps. This means — if you’re headed through an area covered by Google’s Street View — you can now use photographs of each intersection to guide your journey, with helpful arrows superimposed to show your path.
Though the areas covered by Street View in Houston were recently expanded, most inside-the-Loop neighborhoods are still not covered. Let’s say you’re at the new Pagoda Vietnamese restaurant near Cottage Grove, trying to find your way to Chinatown — you know, that neighborhood on Bellaire in southwest Houston, where all those Vietnamese restaurants are. If you plot your trip using Google maps, the directions won’t show photos of your first few turns. From I-10 on, though, you get preview photographs of every intersection. And you can pan and zoom around them, as if looking for oncoming traffic.
After the jump: A video from Google, showing how Street View directions work . . . and what they’re good for.
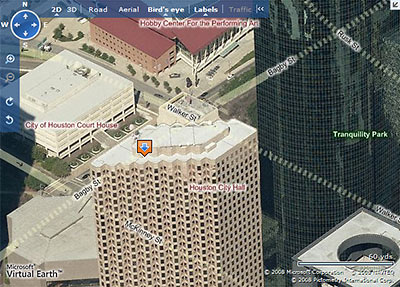
Microsoft has updated its Live Search Maps with a number of new features, the most striking of which is the ability to view a street-map overlay on the maps’ signature 3D aerial views. This should be especially helpful to the armchair pilots among you who have been flying blind through Microsoft’s “bird’s eye” views, trying to figure which street is which as you rotate around a property.
Since HAR’s recent update, Live Search Maps are now linked directly to property listings. However, those maps do not include the new street-highlighting feature. To see this new feature, go to maps.live.com and enter an address, then click on the “Bird’s eye” button at the top. Street highlighting automatically appears, but you can turn it off by clicking on the button at the top marked “Labels.” As before, you can rotate the direction of your view by clicking on the N, S, E, or W in the top left corner.
Now here’s a problem: What happens when the newly highlighted streets run behind a tall building? As our sample image above shows, they don’t just run — they dash!
After the jump: How to avoid traffic online!
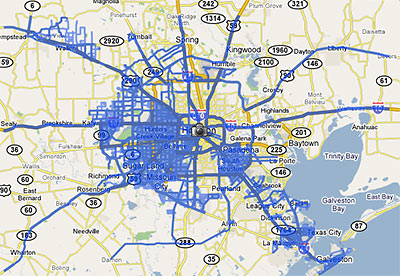
Last week Google rolled out a major update of its Street View feature, adding 13 new cities and a national park, and expanding its coverage in 6 cities . . . including Houston. The map above shows the extent of the Houston street-level photos now available through Google Maps.
Previously, street views from Google Maps were available only from major thoroughfares in the Houston area. Now, they are available on just about every street . . . within the areas marked in blue. South Houston, plus areas west of 290 and 288 outside the Loop are now mapped street by street. But most inside-the-loop neighborhoods are still left out.
Strangely, this means Google Map addicts can stalk Cypress subdivisions virtually street by street, but views of Southampton are limited to sideways glances from Shepherd and Bissonnet.
After the jump: a sampling of the new street-level views of westside neighborhoods!

Who came up with the name “iSettle” for HCAD’s new online settlement system for property-tax-assessment protests? It’s a name that appears crafted to attract the most docile of protesting taxpayers — which should work out well for the appraisal district: If you’re one of those more contentious homeowners who won’t settle for iSettle’s email offer in response to your protest, HCAD staff won’t even bother scheduling an informal meeting for you with an HCAD appraiser. You go straight to a formal hearing!
If you file your protest on line using iFile and indicate a realistic opinion of value, your account may be selected for an on-line settlement offer. The appraisal district reviews the protest and its own evidence, as well as trends in reductions in surrounding properties. If your suggested value falls within those parameters, a settlement offer will be sent to you at the email address you give when you file. Normally, you will have 10 days in which to log on to the iFile website and accept the offer. If you accept the offer, you won’t need to attend any appointments. The records will be changed and you will receive confirmations via email and regular mail. If you do not accept or do not respond, your account will be scheduled for a formal hearing . . . with the appraisal review board.
If you aren’t otherwise inclined to protest your home’s appraisal in person or hire a firm to do it for you, iSettle is probably worth trying. But personable homeowners with negotiating skills who’ve been able to finagle appraisal reductions in the informal meetings may want to avoid it.
And iSettle won’t be available to everyone anyway:
The iSettle process will be available only to individual homeowners. Most neighborhoods are eligible, but a few neighborhoods are not because of the complexity of the market in those neighborhoods. If you aren’t eligible, we’ll notify you.
Heights residents: This means you.
[youtube:http://www.youtube.com/watch?v=iJm4DykNPOg 400 330]
If only Marvin Zindler had lived to see this!
Houston’s longtime consumer reporter is no longer around to deliver his stirring “Slime in the Ice Machine!” reports on TV, but Harris County Public Health & Environmental Services is now allowing online access to its database of inspection reports for retail food establishments.
Though it’s not nearly as user-friendly as, say, being able to see letter grades in restaurant front windows, the ability to search through reports online is a big step forward. And hey, now that they’re available, maybe someone can turn distributing inspection report cards to county restaurants into a business.
If you’re on the prowl for ice-machine violations in the new database, maybe to put into your own Zindler-style restaurant-inspection broadcasts on YouTube, look for “Slime on soda nozzles, soda gun & holster, ice machine, yogurt machines” under inspection item 25, “Food Contact Surfaces of Equipment and Utensils Cleaned, Sanitized/Good Repair.”
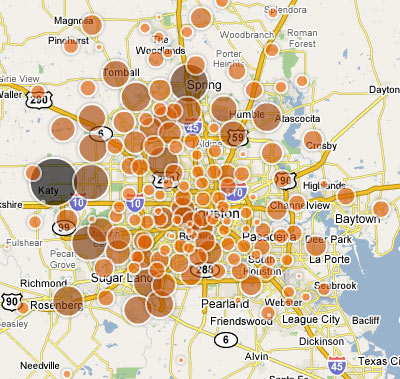
There’s been so much exciting news for dedicated Houston foreclosure gawkers lately. Last month’s HAR redesign added a feature that allows anyone to search current MLS listings for foreclosed properties. And now the Chronicle has put together its own database chronicling foreclosed properties by neighborhood. Plus, the paper includes the handy interactive foreclosure map pictured above, full of dancing bubbles!
A lot of that bubbly makes it look like the foreclosure corks have been popping more frequently in the outside-Beltway-8 neighborhoods, with Katy the big winner. And the map is fun to play with and click on. But don’t miss the more mundane-looking 2007 Neighborhood Foreclosure list, which allows you to sort data on neighborhoods that had 5 or more foreclosures last year, and which spills some fun real-estate secrets . . . like Tremont Tower‘s 97.37 percent foreclosure rate! Bear Creek Meadows‘s 83 foreclosures! And the Memorial Cove Loft Condos’ perfect record: 20 units, 20 foreclosures — in one year! How’d we miss that one?
If you have time to play with these fun tools, and unearth any interesting data, let us know what you find!