05/14/09 10:31am

Swamplot readers have a few things to say about Greenwood King’s latest fancy-neighborhood market report, which came out yesterday! Our regular GK watcher notes that the separate breakdowns for new construction and existing home sales introduced in last month’s edition have been abandoned. Still:

The news is relatively bad. Sales volumes are down sharply all over town. 17% more high end listings than last year . . . River Oaks, Tanglewood, Boulevard Oaks, and Memorial Close In are all over 12 months of inventory. . . .

The 17% higher inventory is reflective of a market of motivated sellers. By definition, a high end homeowner should not “have to” sell unless there has been a life change (divorce, death, job interruption). Everyone knows the housing market is weak in 2009, so…. the only class of sellers on the market are those having cash flow problems or those who have to sell due to a life change. There are almost no trade up sellers right now.

Memorial has 19.1 months of inventory

. . . as big $3-5 million white elephants sit there waiting for the landscapers to come and cut the lawn for the week. It takes a good $20,000 a month to live in one of those monsters. I guess the supply of willing millionaires just isn’t going to match the number of mega mansions. It will take some time, but they will soon move onto bank balance sheets and then to the auction block.

CONTINUE READING THIS STORY

04/29/09 11:48pm

COMMENT OF THE DAY: SHOW ME THE DEALS! “I would like to ask you to show us how right you are by pointing me to some properties inside the Loop that could be purchased for 2005 prices. I have buyers. Really ready finance-able buyers. Of course, you had better send me a lot, or my buyers will bid your properties up to a price past 2005 prices in a heartbeat. So, let me at them. I am ready. I search the market constantly, and would love to present these ‘2005’ deals to my buyers, but I am not seeing them. . . .” [Harold Mandell, commenting on Popping That “No Housing Bubble in Houston” Myth]

04/29/09 9:53am

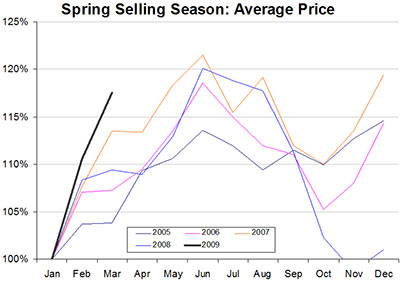
Enjoy your spring, everyone! Armed with a few pointed charts fueled by the latest data from HAR, Swamplot’s spreadsheet-wielding correspondent writes in again, this time with comments on March’s residential real-estate market report:

The Realtors always speak breathlessly of the “Spring Selling Season” with an almost religious reverence. Well it shows in the data. Home sales are 60-100% higher in the warm weather months. Prices are 10-20% higher, too. . . .

CONTINUE READING THIS STORY

04/15/09 12:51pm

The Swamplot reader who’s been focusing on Greenwood King Properties’ monthly market reports has spotted some problems in the latest sales data. The latest report, for the first time, provides separate totals for new homes and resales:

If dollars fall by more than units, then price has fallen.

If you add together 2 significant segments and one is lower and one is flat then the total is lower.

The quick math doesn’t work!!!

How can Flat+Down=Flat??

How can -38% dollars and -33% transactions = Flat??? It implies lower prices…

So now I have a report that raises more questions than answers. Total sales prices are flat? Resale prices are flat? ALL of the pain is in new construction?

Price has always followed volume in every market around the country. So are the price drops for resales ahead of us now? The average resale high end home in Houston is now $585,000??? Isn’t that LOT VALUE in most of these neighborhoods? We never got the news on what happened over the past 3 or 4 years on resale only. Were prices actually flat on the way up?

A few more comments on looming problems in the market for high-priced homes:

CONTINUE READING THIS STORY

04/14/09 11:31am

Swamplot’s Greenwood King-watching reader informs us that the real-estate firm’s March survey of home sales in Houston’s tonier neighborhoods is already out — early, this time. And this month the report details separate data for new construction and resales. Snarks the GK watcher:

This is a typical reaction of the Realtors to falling prices. Find a way to re-segregate the market to make the bread and butter look OK. Last year it was “Inside the loop never goes down!” Pretty soon we will see the market cut into “Three Story (-34%) Two Story (-2%) and One Story (-26%) homes.”

Hmmm . . . not a bad idea! But what about the new numbers?

CONTINUE READING THIS STORY

04/10/09 4:32pm

COMMENT OF THE DAY: THE NOTTINGHAM FORESTS OF THE FUTURE “. . . it is amazing how that works in Houston. Same house, probably same builder, same sort of subdivision when it was new. If that same oil and gas junior executive had bought the same new house back in ‘70 in Nottingham Forest, he’d be looking at a $450K + pay day. It will be interesting to see which areas developed in the most recent boom will be the Nottingham Forests and which ones will be more like this subject. Any speculations out there??” [subprimelandguy, commenting on Neighborhood Guessing Game Over: The Houston Highlands]

04/07/09 5:03pm

PLENTY OF EXPENSIVE HOMES FOR SALE IN AFTON OAKS Judy Thompson updates the neighborhood stats: “The Zip Code Feeling the Most Pain is . . . . definitely 77027, the Afton Oaks area. Today’s market condition update shows six of its eight price ranges to be . . . a buyer’s market. This is happening at the high end, a result of so much redevelopment during the past decade. This zip code also experienced the highest appreciation in recent years in price per square foot paid so you might say they experienced a slight ‘bubble’ that is now bursting.” [Strictly a Buyer’s Agent]

04/06/09 1:17pm

The Houston Chronicle‘s annual neighborhood-sales-data extravaganza came out this weekend. Since it covers the 2008 calendar year, the survey is timed just right to document the continuing drop in sales and prices of far-flung lower-priced homes — but maybe a bit early to catch the extended Wile E. Coyote-style midair hang a fair number of closer-in half-a-million-plus homes on the market are currently experiencing.

A few highlights:

Sales activity dropped in all counties for non-foreclosure transactions. All counties showed a rise in sales of foreclosed homes.

And those foreclosures are also clearly missing the bullseye: In 2008 there were only 362 foreclosures inside the Loop and 2,556 between the Loop and Beltway 8 — but a whopping 9,342 outside the Beltway. In total, foreclosures were only up about 11 percent over the previous year. But the number of non-foreclosure sales dropped by almost 22 percent. So in 2008 foreclosures accounted for just under 22 percent of all sales.

Where did the prices fall last year?

CONTINUE READING THIS STORY

03/25/09 9:03am

SECOND-TO-LAST OF THE GREAT HEIGHTS TRAILER PARKS One of the last two trailer parks left in the Heights may not last much longer. Marian Floyd, owner of the Floyd Trailer Park — camped on a double-wide lot a couple properties west of Studewood on 9th St. since 1972 — has been having a tough time keeping up with rising property taxes. “Floyd said she needs to make a living, and she’s not willing to kick out her residents. She knows they don’t have much money, so she’s kept rent low over the years. But as property values — and the taxes she has to pay — have soared, Floyd has struggled to make ends meet. Between 2004 and 2008, the value of the park’s land soared from about $155,000 to $362,600, according to county records. . . . When Floyd threatened to close the park last month, the residents offered to pay more rent. Gloria Aguilar who lives in a nearby trailer with her husband and three children said she’d pay $300 per month instead of $200. Carlos Salgado, who lives with three friends, offered $300 instead of $225. Gutierrez, too, said she’d pay more. The landlord relented. But the trailer park’s residents worry for the future.” [Houston Chronicle]

03/20/09 5:08pm

HCAD APPRAISALS: THE $500K DIVIDE 45 percent of the 860,000 single-family-home appraisals completed by HCAD so far this year show a lower market value than last year; 39 percent are the same, and 16 percent have gone up. “‘Appraisal value is down about 2.5 percent (overall),’ said Assistant Chief Appraiser Gus Griscom of the completed figures. . . . Homes valued at $500,000 or more received the highest percentage of actual value increases. Homes valued at $250,000 or less were given the highest percentage of value reductions. Overall, of the statements currently being mailed, homes valued at more than $500,000 saw their market values increase on the average anywhere from 5.17 percent at the lower end to 5.81 percent for homes valued at $1 million or more. The above-$500,000 valuation group accounts for a little more than 3 percent of the appraisals being mailed.” [River Oaks Examiner]

03/18/09 5:48pm

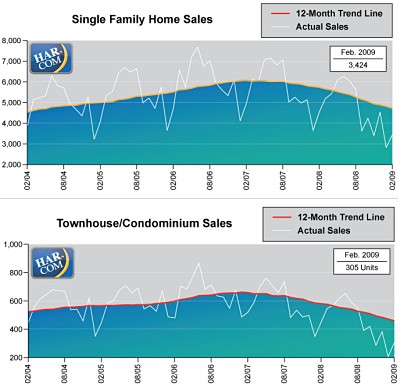
Looks like HAR has responded to some Swamplot reader criticism and added a bit of needed real estate to the bottom of the charts in its latest report — as well as a thin white line to indicate actual, non-adjusted values. The changes and the addition of the latest numbers show a market that doesn’t seem quite so steady as last month’s HAR report made it seem.

There were 25.9 percent fewer property sales this February than last, according to the report. But our reader’s 3-month-moving average chart doesn’t look any worse than last month:

CONTINUE READING THIS STORY

03/10/09 5:46pm

COMMENT OF THE DAY: WEST UNIVERSITY HOMES FOR SALE “You can see the collapse happening in West U. Noticed what I thought were an unusually high number of for sale/for rent signs there in late January, so started keeping an eye on the number of listings. (There’s an easy link on the chron.com site and then you can click on a neighborhood.) At the beginning of Feb. there were 297 residences listed. It has climbed more or less steadily over the past 6 weeks and stood at 353 today. A drive down Edloe from Westpark towards Holcombe is almost scary. There is a combination of developers finishing the last of the giant McMansions for this cycle and likely reseting of adjustable rate mortgages and job losses. There will probably be a cascading effect as very expensive places that can’t be sold get reduced and put pressure on prices of smaller places that have to be cut in turn. . . .” [MikeRG, commenting on Those Wet and Wild Houston Mortgages: 18 Percent Now Underwater, 7 Percent More Still Paddling for Air]

03/05/09 1:32pm

Sure is nice for us Houston didn’t get caught up in that big price run-up housing markets in the rest of the country fell for! That’s why in Houston real estate is in much better shape than it is everywhere else, right?

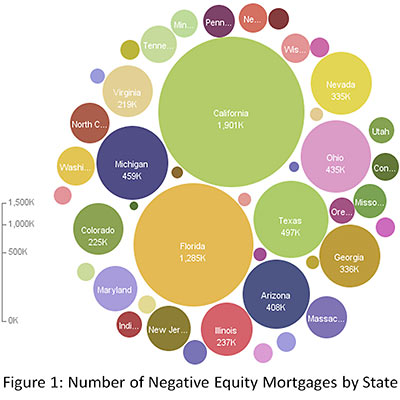
Not according to a study released yesterday by First American CoreLogic. The research firm estimates that 18.3 percent of all mortgaged properties in the Houston-Sugar Land-Baytown region are in a “negative equity position,” and another 6.7 percent are within just 5 percentage points of being there. “Negative equity,” AKA “I’ve fallen down and I can’t get up,” means a mortgage holder owes more than the underlying property is worth.

In other words, 1 in every 4 Houston-area mortgages is already in deep doo-doo.

But hey, all it’ll take to recover is for prices to rise a little! And the rest of the country is doing much worse, right?

CONTINUE READING THIS STORY

03/03/09 6:14pm


The last time
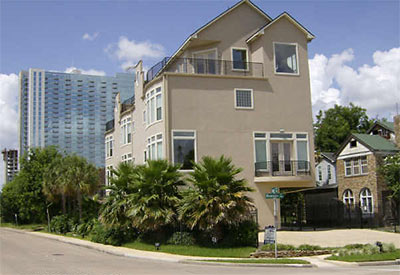
the peachy little townhouse-by-the-freeway at 2232 Riverside Dr. was available for sale — in the good ol’ boom-boom days of May 2007 — the owner refused to make any repairs on the property, which was listed for sale at just under $500K. What’s up with it now?

A good year after it was sold (for a much lower price, about half[!?] of what someone paid for the next-door unit just a few months later), the 2003 townhouse with the front-row view of 288 went back on the market! And it’s still there.

CONTINUE READING THIS STORY