FERTITTA: THAT WAS NOT ME IN THAT STUDEWOOD ST. DIVE 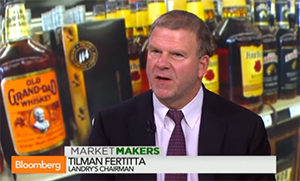 Billionaire Landry’s CEO Tilman Fertitta categorically denies that he was recently seen in venerable Houston Heights dive bar the Shiloh Club, knocking back cocktails and peppering regulars for local information. “I was not there,” the world’s richest restaurateur tells the Houston Chronicle‘s Nancy Sarnoff. He also denied rumors of a pending Landry’s land invasion of the Heights. (His Shepherd Dr. Saltgrass-and-Cadillac-Bar mini-stronghold will stay in Cottage Grove south of I-10 for now.) He’s about volume, something the Heights can’t provide him in ample measure: “The way that I’m set up, I have to do a lot of business, and they’re more smaller restaurants.”  With one potential exception: “Brenner’s on the Bayou could be there. But that’s probably around here the only (Landry’s) restaurant that could be in the Heights.” Fertitta went on to reiterate and expand on a bearish short-term real estate market forecast he first delivered on Bloomberg TV earlier this month. [Houston Chronicle; previously on Swamplot] Photo: Bloomberg TV
Tag: Forecasts
TILMAN FERTITTA SEES AND SMELLS A NATIONWIDE REAL ESTATE CRASH, STARTING IN HOUSTON  Landry’s CEO and purported Shiloh Club irregular Tilman Fertitta ladled out a deep bowl of bear stew from the teevee-front kitchen of his restaurant empire Wednesday, telling Bloomberg TV viewers that he smells a national real estate crash on the order of what happened in 1986, and volunteering that he “can see it in Houston right now.” He prefaced these comments to hosts Erik Schatzker and Stephanie Ruhle with a survey of the “crazy numbers” he is seeing in real estate valuations and transactions: “You are seeing it in New York probably more than anywhere else; but you are seeing it in Texas; you are seeing it in California. And . . . history always repeats itself as we always know, but I think it’s going to repeat a little sooner this time. You can just see it coming. There are so many cranes everywhere.” What’s the trigger? “If oil stays in the 70-something dollar range — where it is right now — you’re gonna see it in Houston first,” he said, adding that it might take an oil price of $50 a barrel to bring on a “total crash” like the one in the eighties that knocked Houston off its feet for a good decade. Fertitta continued his jeremiad with a few complaints about inflation, which he sees as “huge,” no matter what Ben Bernanke has to say to the contrary. [Bloomberg TV; previously on Swamplot]
COMMENT OF THE DAY: HERE COME THE ALMEDA PROMOTERS “Washington ave is already done. . . . Whats next you ask….Almeda (59 to med center)….two bars opening right now and four more planned on the way. Wide streets, lots of empty places to park, a community who wants the crowd and can handle it better than wash or mid town. The two bars that are going in are building out in empty spaces right now but more on the way with some new buildings planned. You will all want to know where I get my info but [ride] down and you will see for your self what I know.” [Dj Ashby, commenting on Comment of the Day: Reading the Washington Ave Crystal Ball]
COMMENT OF THE DAY: READING THE WASHINGTON AVE CRYSTAL BALL “Eventually people will get sick of having no place to park and the hot spot will move on. Prediction is for Brixx to go out of business within six months, Eight will turn into a restaurant within a year and Taps will probably stay as it is. Not sure about Roosevelt – could become a restaurant as it does have a parking lot of its own.” [MC, commenting on What It’s Like to Live on Center St.]
CROWDING THE HOUSTON DINNER PLATE “According to USDA maps, we still have about 3.2 million acres of prime farmland within 100 miles of Houston. We can’t produce everything we like and want to eat. No cacao trees for chocolate here, for example. A more relevant question is whether we could supply most if not all of our basic needs from soils within a hundred miles or so. I think the answer is yes. The amount of land to support one person varies in the scientific literature from less than an acre to 20 or so acres. With 4 million people, we would likely need at least 2-4 million acres of farmland. But we are expecting 3.5 million more people by 2035. So not only will there be more people to feed, there will be less land to feed them from, locally. If current density and development practices continue, we can expect to lose at least 1,000 square miles of prime farmland, prairie, and forest habitat to development.” [OffCite]
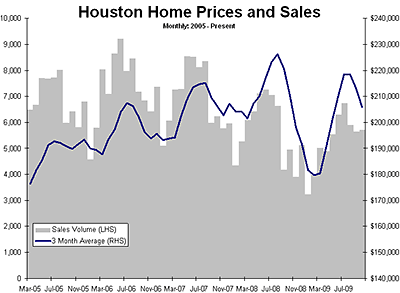
Swamplot’s chart-wielding analyst is back with a few comments on the Houston Association of Realtors’ latest report and media push:
Median and average home sales prices fell $7,200 from the prior month. This was including increased activity to get the $8,000 home buyer tax credit in under the wire! Now it is not fair to compare month to month numbers as seasonal factors are working against the housing market this month.
So we get some good spin from the realtors: “Home prices up 5%†“Sales up 13.8%†…this maps directly over to the mainstream press with no research: “Home sales rise for second month,†“Home prices up 5%,†“Sales up 13.8%†Homeowners in this town should be proud that such a hardworking PR machine still gins out great product!
Why would you call those year-over-year increases spin?
The realtors get to make a press release every month and every month something is a “record†and the press is under deadlines and it gets copied in verbatim. This is home prices up 5% and sales up 13.8% from HURRICANE IKE with no caveat in the headline going out to 200,000 print readers and as many web readers! Not bad for a days work.
Oh, yeah. Forgot about that whole Ike thing. So what’s the market looking like really?
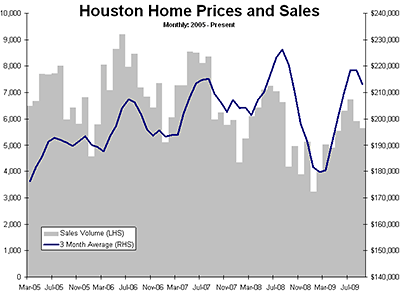
HAR is out with its September home-sales figures, giving Swamplot’s spreadsheet-side correspondent a chance to eulogize the spring-summer selling season:
Home prices and volumes are flying south for the winter. With this volume downturn for the year, we have most likely seen the highs and sales volumes will now complete their third year of contraction. Prices were down 2-3% in the month, depending on whether you follow the median price or the average price. Pending sales are well below sales for the month, suggesting a further seasonal contraction in October.
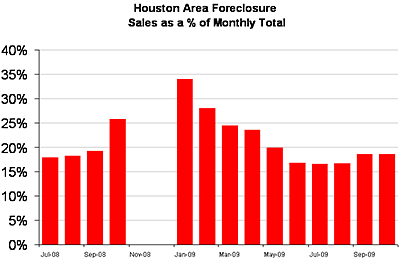
This month featured an upturn in foreclosure sales as a percentage of the total. Foreclosure sales were 18.6% up from 16.7% the prior month. Luckily, foreclosure sales are still way down from the 32% peak in January.
But aren’t all those foreclosures going away soon?
COMMENT OF THE DAY: WHERE THE SKYSCRAPERS WILL BE BUILT “. . . in a century or two, Houston will be very densely populated. . . . I think Houston is relatively lucky to have street grids across most parts of the city, as opposed to the suburban lollipops in, say, Pearland’s newer subdivisions. When the skyscrapers come — and they will — then Houston’s grids will handle the load better than the lollipops would; and if worse comes to worse, old blocks can be razed for new streets, or our existing streets can be turned into one-way, so that for example you might have Bellaire and Westheimer only go westbound, and Richmond and San Felipe only eastbound (or vice versa).” [J.V., commenting on City to Ashby Highrise: Yes You Can!]
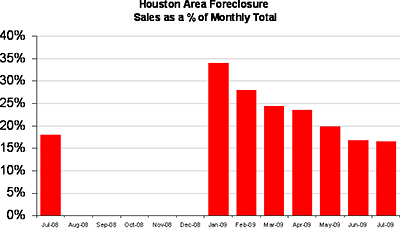
HAR’s real estate sales report for July is out! And Swamplot’s housing-market reader-analyst uses the data to piece together a better picture of Houston’s still-somewhat-mysterious foreclosure scene:
The press releases in 2009 have included a running commentary on the % of foreclosure sales in the month. This month’s release featured an interesting nugget — foreclosure sales from the prior year’s month! It is new information, and a few future monthly releases of it will allow us to fill in the data gap in the graph [above].
The foreclosure graph can be looked at in two ways. The glass half full crowd can cite the fact that a wave of foreclosures has been passed through the system — like a painful kidney stone — and it hasn’t led to piles and piles of unsold homes on top of each other in a negative feedback loop. Inventory is down to 6.5 months, backing this view.
And what if you aren’t sure there’s enough water in that glass to, uh . . . pass those stones?
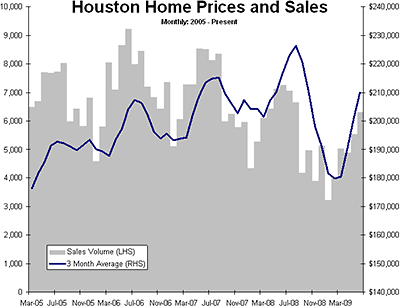
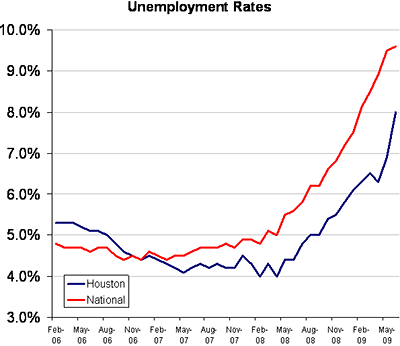
“The increase in local unemployment reported this week is sickening,” reports Swamplot’s local financial correspondent. But don’t the latest HAR numbers show Houston home prices at some sort of record high?
Historically, the peak for home prices comes in July or August every year. The increase in the median and average over the past several months has been due to two factors. First, seasonality –summer prices are always the highest. Second, a change in the “product mix†of Houston homes –the % of foreclosed homes has fallen every month for several months straight . . . So the change in the product mix means that the value of any given house probably has not risen, only a change in the product moving through the system is reflected in the numbers.
Is it okay to get excited about the foreclosures, then?
COMMENT OF THE DAY: MINING THE TAX RECORDS “Here’s my method to determine medium-term appreciation rates: 1. Look up a given house in HCAD.org. Make note of the current year’s appraised value. 2. Click the View link for the Harris County Tax Records. 3. Click the “View 15 year tax/value history†link on the following page. 4. On the graph on the following page, hover your mouse over the year farthest back (e.g. 1993). 5. Find the percentage difference between the appraised value from the current year and the appraised value from the year farthest back, and there’s your medium-term appreciation rate. It’s a quick and dirty method, but it really opened my eyes to the areas that are the best investments from a financial standpoint.” [Alan, commenting on Baby Needs a New Pair of Schools]
HOUSTON RENT DEALS A broker tells reporter Amy Wolff Sorter that no new multifamily apartments — beyond the 14,000 units currently “in the pipeline” — are likely to be built in the Houston area until 2012. MPF Research says the multifamily occupancy rate for this area is hanging at around 89.7 percent, not too far from where it was last year: “. . . rents continue to hold steady and concessions aren’t being jacked up in response, though they do exist. [MPF’s Greg] Willett points out that about 38% of the product on the market today has some sort of concession, with the typical giveaway hovering at a 9% discount, which translates to a little more than one month of free rent. Still, ‘that really hasn’t moved,’ Willett remarks. ‘We’ve been at that 9% figures for awhile.’ Both [Apartment Realty Advisors’ Matt] Rotan and [CB Richard Ellis’s Craig] LaFollette say that the infill locations are faring better than the outer submarkets, which are giving away up to two months free rent.” [Globe St.]
COMMENT OF THE DAY: HOW CLOSE ARE THOSE NEW APARTMENT COMPLEXES? “I wonder how much the apartment supply in the south areas (below the medical center and rice u) affect the apartment supply along Buffalo Bayou, Midtown, Montrose, and Upper Kirby? From the site development group at my office, they are telling me that the apartment market will heat up if the housing slump holds or gets worse. Right now developers are scouring for new sites for apartment complexes if they haven’t already.” [kjb434, commenting on Comment of the Day: Inner Loop Rents, Hard and High]
More comments on Greenwood King’s April market report, which focuses on real estate activity in Houston’s higher-end neighborhoods. A second reader focuses on prices, determined to find storm clouds in the report’s silver lining:
While some avg. sales prices are higher, this is most likely due to builders no longer buying lots to build on for b/t 400 and 500k.
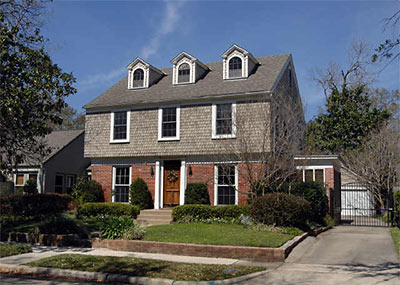
Last week you had a poster ask to see the evidence of price declines and an eroding market. Here is further evidence of a declining market. Moreover, the poster requested to see comps that show declines. I think I have proof. Can we get a Realtor to confirm that a prime West U. property–3128 Lafayette–sold for 700,000 over two years ago and now has been recently reduced to 699,000. Welcome back to 2007–[how] much further do we have to go?
One problem with finding these declining comp examples (and I think there are more, and more on the way), is that the Realtors control all of the data and are reluctant to admit that the prime inner loop area that has been so good to them is begining to substantially turn negative.
- April Houston Market Report (PDF) [Greenwood King Properties]
- Greenwood King April Report: Getting a Little Crowded at the Top of the Market [Swamplot]
- Comment of the Day: Show Me the Deals!
Photo of 3128 Lafayette St. in West University: HAR
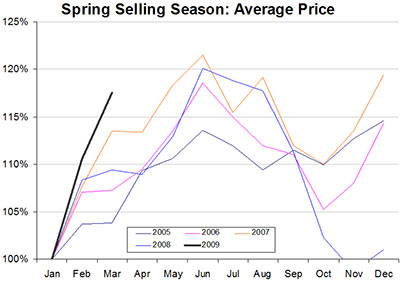
Enjoy your spring, everyone! Armed with a few pointed charts fueled by the latest data from HAR, Swamplot’s spreadsheet-wielding correspondent writes in again, this time with comments on March’s residential real-estate market report:
The Realtors always speak breathlessly of the “Spring Selling Season†with an almost religious reverence. Well it shows in the data. Home sales are 60-100% higher in the warm weather months. Prices are 10-20% higher, too. . . .

